
$260.58. That's where Apple closed today, down 0.77% from the open at $262.60. Not a crash, not a rally — just a slow drift lower that tells you more than you think.
The signal says neutral. Confidence is low. Signal score sits at -9.4, which is basically the market shrugging its shoulders. But the price action? Bullish. That contradiction is the whole story.
The Moving Averages Problem
Both the 10-day EMA and SMA are screaming Strong Sell. EMA at $265, SMA at $268.42. Apple's trading under both, which means short-term momentum flipped. When price drops below the 10-day moving averages, it's not a suggestion — it's a statement that buyers stepped back.
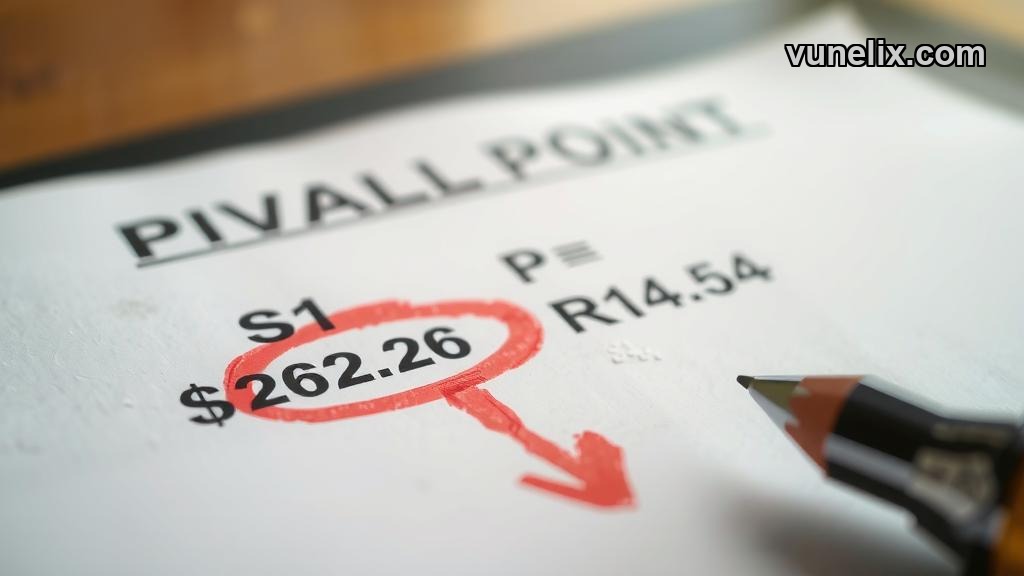
I've seen this setup before. The stock loses its footing, oscillators go neutral, and everyone waits. The question is whether $262.26 — the S1 pivot support — holds or breaks. If it holds, we get a bounce back toward the pivot at $264.54. If it breaks, next stop is probably the one-month low at $244.68.
The RSI at 45.32 is dead neutral. Not oversold, not overbought. The Ultimate Oscillator at 38.11 says the same thing. No extreme reading to fade, no obvious entry. Just.. waiting.
Volatility Is the Real Story
ATR percentage at 2.46% means Apple's moving around more than usual. That's not terrible, but it's enough to make short-term trades messy. You buy at $260, it swings to $254 the next day, and suddenly you're questioning everything.
The six-month performance is up 15.21%, so the bigger trend hasn't broken yet. But zoom in to the past few weeks and it's a different picture. The stock opened the month at $244.68 and ran up to where it is now. That's a decent move. Problem is, it stalled right into the moving averages and couldn't push through.
Classic resistance from above. When a stock rallies into its own averages and gets rejected, that's not bullish. That's distribution. Someone's selling into strength, and the buyers aren't strong enough to absorb it.
Pivot Points and What They Mean
Pivot at $264.54. R1 resistance at $266.63. S1 support at $262.26. These aren't magic numbers, but they're where the math says traders will react. Apple's sitting right between the pivot and S1 support, which is no-man's-land.
Break above $264.54 and there's a shot at $266.63. Break below $262.26 and it gets ugly fast. The problem with neutral signals and low confidence? You don't get a clean setup. You get a coin flip.
I pulled up the stock screener earlier to see how Apple compares to other large-cap tech. It's not alone in this pattern. A lot of names are chopping around, caught between moving averages, waiting for the next catalyst.
The Contradiction Nobody's Talking About
Signal says neutral. Moving averages say Strong Sell. But price action is bullish. How does that make sense?
It doesn't. That's the point. The algos and the chart are telling different stories. Price action bullish probably means intraday patterns — higher lows, tight ranges, small accumulation. But the moving averages and signal score are looking at a longer window and saying, "Yeah, but you're still under resistance."
This is where most people freeze. They want clarity. The market doesn't care. You either trade the setup or you don't. Sitting around waiting for confirmation usually means you miss the move or you enter late.
I checked the most active stocks today and Apple's near the top by volume. That means institutions are involved. When big money moves, volatility follows. The ATR spike makes sense now.
What I'd Do
If you don't own it, I wouldn't buy it here. Not with the 10-day averages above and a neutral signal with low confidence. If you do own it, I'd watch $262.26 like my portfolio depends on it — because it does. Break below that and I'm out. Hold above and maybe we get a bounce back to $265.
I'm not touching it until one of two things happens: either it reclaims the 10-day EMA and holds, or it breaks support and I can short it with a clear stop. Right now it's just noise. And I don't trade noise.

