The pair's up 0.71% today. Buy signal's flashing. Price sits at 108.671, above both the 25 EMA and the 200 EMA. Everything looks bullish on the surface.
Except it's not that clean.
The Confidence Problem Nobody Wants to Talk About
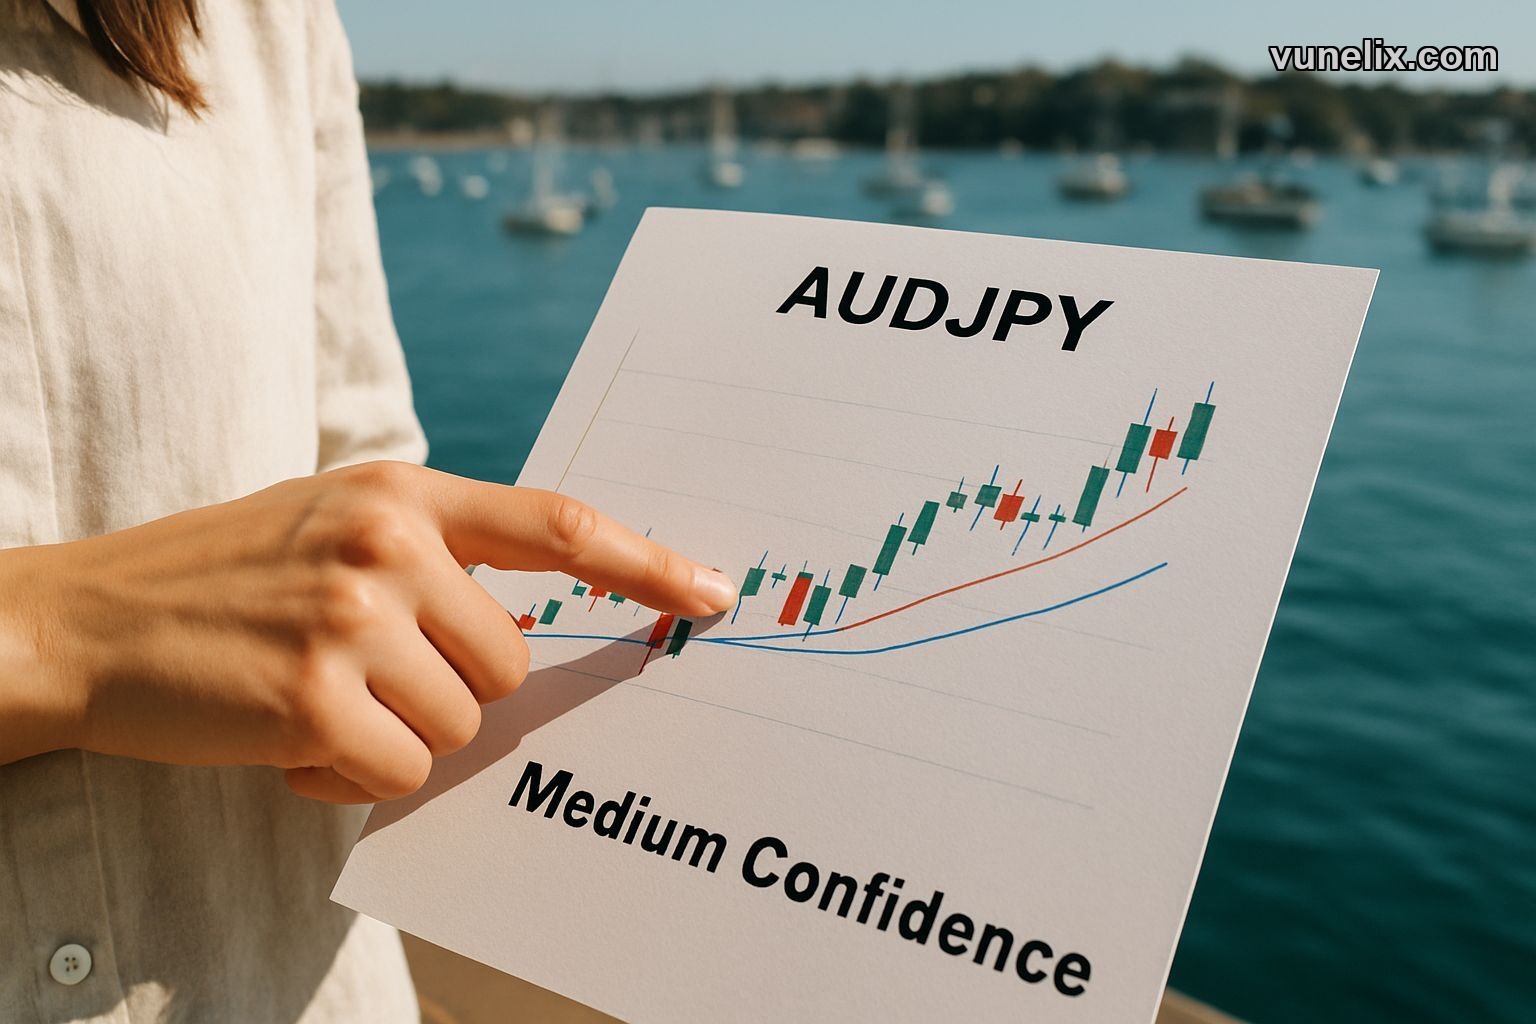
Medium confidence. That's what you get with a 41.7 signal score. Not terrible, not great. The kind of setup where half the indicators scream buy and the other half tell you to wait.
I've been watching AUD/JPY move since it opened at 107.905 this morning. The climb to 108.671 looks smooth enough. Strong trend designation. ADX at 27.22 confirms momentum's there. But here's what bothers me — MACD's sitting at 0.8634 with a Sell reading.
That's not a typo. While most moving averages and the overall signal lean bullish, MACD's calling top. When you get divergence like this, someone's wrong. Either momentum's about to flip or the moving averages are lagging reality.
The Monthly High You Can't Ignore
One month ago, this pair hit 110.794. We're currently 2.12 points below that. Close enough to smell it, far enough to worry.
Last week's performance? Down 1.74%. So yeah, we bounced today, but the recent path's been downward. That's the context missing from a simple buy signal. The forex screener shows you the green arrow, but you have to dig into the performance tab to see the week-long bleeding.

The Bollinger Band position at 42.92% tells you price is hovering in the lower-middle range. Not oversold, not overbought. Just.. there. Squeeze status reads Normal, so we're not coiling for a big move either way.
What the Pivot Points Actually Mean
Demark pivot has resistance at 108.407 and support at 107.31. Current price is 108.671. We're above R1.
That's not bullish. That's extended. When you're trading above your daily resistance pivot, you're either breaking out or setting up to get slapped back down. The middle pivot sits at 108.052 — we've already run 61 pips past it.
ATR's at 1.2359 with a Buy designation. Average True Range doesn't predict direction, it measures volatility. So yes, there's movement, but that cuts both ways. A 1.23 ATR means this pair can swing hard in either direction without warning.
Why This Buy Signal Feels Uncomfortable
I'm looking at the EMA 200 at 101.05. That's 7.62 points of cushion below current price. Long-term trend is definitely up. No argument there. But short-term momentum measured by MACD is showing exhaustion.
The currency heatmap gives you a visual sense of how currencies are moving against each other today. AUD's probably showing strength, JPY weakness. Classic risk-on setup. Until it's not.
Here's the risk nobody mentions: Japan's monetary policy can shift faster than Australia's economy can respond. One statement from the BOJ about potential tightening and this pair drops 200 pips in a session. You're long a currency pair that's politically sensitive on both sides.
Australia's commodity-dependent. Japan's intervention-happy. You're not trading a chart pattern. You're trading two central banks and their respective economic outlooks in February 2026.
The Actual Entry Question
If you're buying here at 108.67, where's your stop? Below 107.31 support gives you 136 pips of risk. That's not a tight stop. Below the pivot at 108.05 is only 62 pips but also gets you stopped out on normal volatility given the ATR.
Where's your target? The monthly high at 110.79 is 212 pips away. Risk-reward looks okay if you use the pivot stop. Looks bad if you're stopping below Demark support.
The charting tool on Vunelix lets you plot these levels yourself. You'll see what I'm seeing — price action that's technically bullish but structurally questionable.
What I'd Actually Do
Medium confidence means medium position size. If you normally risk 2% per trade, cut it to 1% here. The signal's not strong enough to bet the farm.
Watch how price handles 108.40 on any pullback. That's your R1 pivot. If it holds as support, the buy signal has legs. If it slices through, we're heading back to test the EMA 25 at 107.87 or worse.
MACD Sell with a Buy signal is a yellow flag, not a red one. It means be cautious, not avoid entirely. I've seen these setups work when broader market momentum carries the trade despite indicator divergence.
The Strong Buy from ADX matters. When ADX is above 25, trends tend to persist. We're at 27.22, so there's real directional strength here. That's your best argument for taking this trade.
But check the top losing forex pairs before you enter. If AUD pairs are broadly weak despite today's move, you're catching a bounce, not riding a trend.
The Forecast
We'll test 110.00 psychological resistance within the next week, but getting past the monthly high at 110.79 requires more than a Medium confidence signal and conflicting indicators.