You look at Bitcoin today, February 21, 2026, and it’s hovering around 67799.43. Just dipped a bit from its open at 67992.49. A tiny 0.284% drop, barely a whisper on most days. But then you peek at the broader signal, and it screams SELL. High confidence, they say. A -58 signal score that just solidifies it.
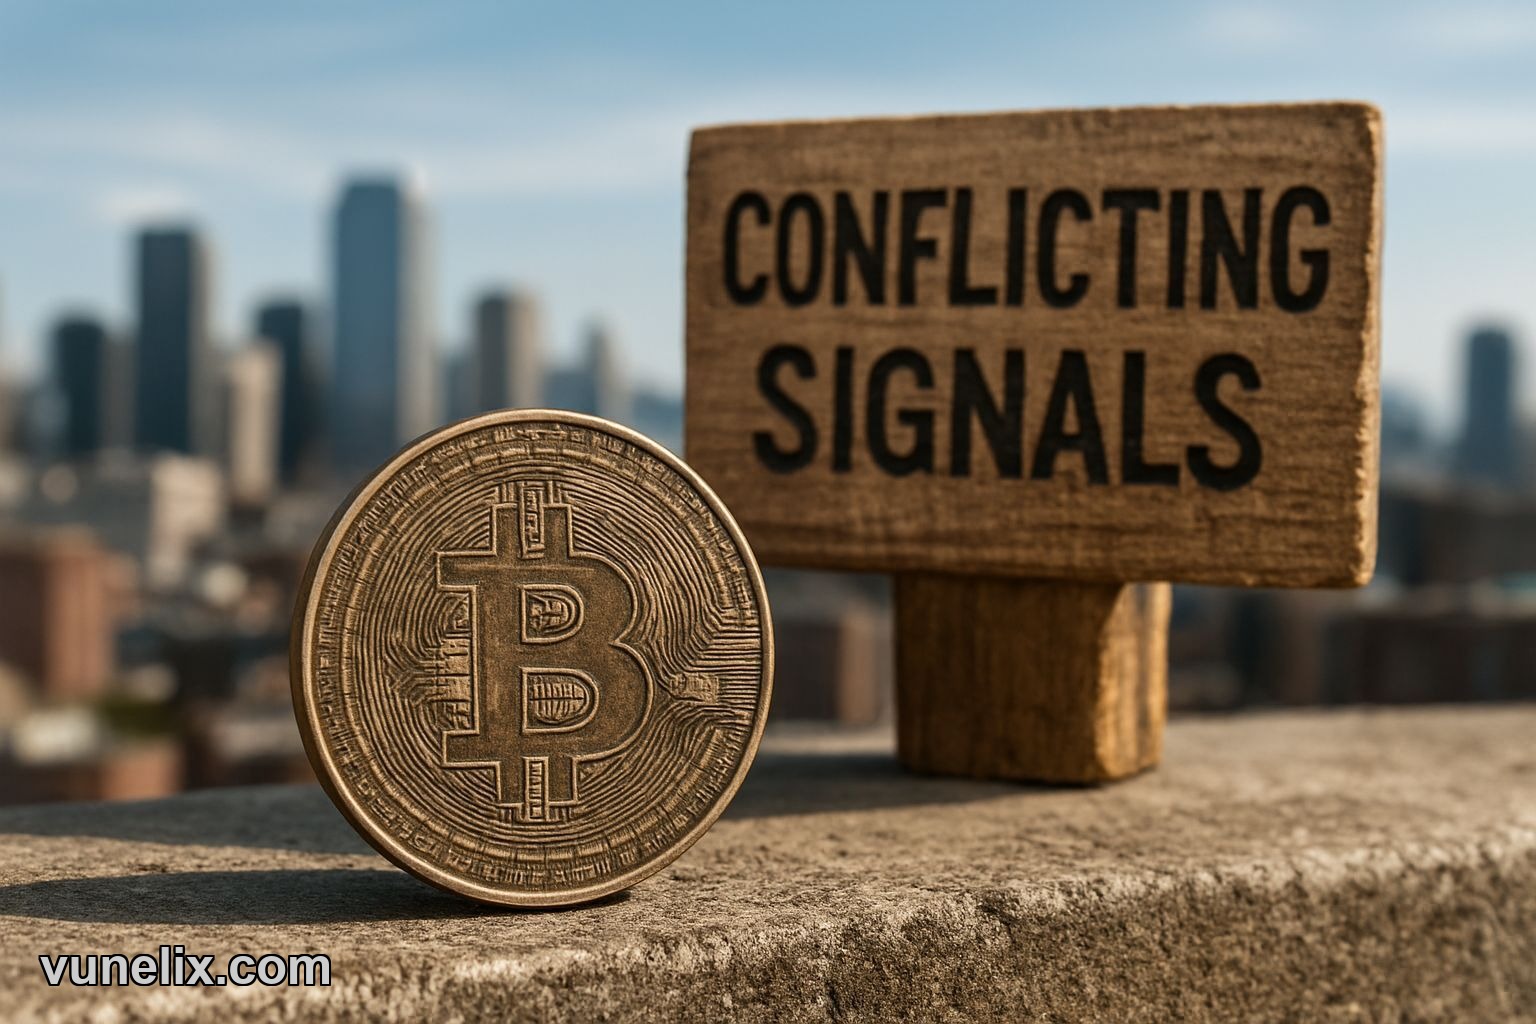
I mean, what gives? We’re looking at a "Strong" trend, yet the price action is "Bullish," even with that tiny everyday slip. It’s like the market can’t quite make up its mind, pulling in a hundred different directions. This isn't just a "normal" candle pattern, this is a normal pattern in an utterly confusing market. If you're wondering what the hell is going on, you're not alone. I've been watching this stuff for years, and these kinds of mixed messages? They're pure chaos.
Why The Market Whispers Sell
Let's be blunt: the primary signal is a Sell. Not a soft suggestion, but a proper, high-confidence signal. When you pair that with Bitcoin's performance over the last six months, it starts to make a lot of sense. We're talking a brutal 40.3205% downturn. Forty damn percent. That’s not a hiccup, that’s a gut punch.
You remember those good old days? The all-time high of 126230.09? Or even just last month’s high of 91137.33? Those numbers feel like ancient history now, don't they? The current price of 67799.43 is nowhere near sniffing those levels, and that’s a cold, hard fact. This isn't just a dip; it's a significant correction, maybe more.
I made a call back in late 2025, thought we’d found the bottom around the 75k mark. Absolute garbage call. Lost a decent chunk on that conviction play. You learn, though. You learn that sometimes the strong trend, even with a seemingly bullish price action, is just a sucker rally when the big picture is pointing down. Bitcoin price today, it tells a story of struggle. Go ahead, check the full charts for yourself here. See the carnage.
The Oscillators Scream Back: Buy!
Now, this is where it gets spicy. Despite the overarching Sell signal, the short-term indicators are having a complete identity crisis. Seriously. Look at the oscillators. The ADX is at 57.983, shouting "Strong Buy." Not just a buy, a strong buy. And the RSI? Sitting pretty at 37.0467, also saying "Buy."
So you’ve got the main signal waving a red flag, but these shorter-term technicals are all about green lights. What's a trader to do with that? My take? It means there's some underlying strength trying to push back. Short-term bounces, maybe some accumulation. But it's fighting against a serious headwind, no doubt about it. It makes you wonder if these signals are just catching little temporary upticks within a larger downtrend. The conflicting information is enough to give anyone a headache.
This is where the game gets messy, where you have to decide which voice in the market you're listening to. Are you buying the dip based on the oscillators, hoping for a quick flip? Or are you respecting the big Sell signal, letting it ride lower? I’ve seen good people get burned chasing those oscillator buys when the bigger trend is against them.
Moving Averages Tell a Different Story
If the oscillators are yelling buy, the moving averages are singing a somber ballad of "Strong Sell." It's not just a little divergence; it's a Grand Canyon of disagreement. The EMA 100? Way up at 85531.99. The SMA 200? Even higher, a whopping 99170.61. Current price of 67799.43 is far, far below these levels.
What this means is simple: from a longer-term perspective, Bitcoin is seriously underwater. These big moving averages act like a resistance ceiling. Until we punch through those, particularly the SMA 200, any rally is just that: a rally in a bear market. They’re like gravitational pulls, keeping the price anchored down. The only one that's close is the SMA 10, sitting at 67914.61, which is practically right on top of today's price, making it "Neutral."
The neutrality of the SMA 10 compared to the strong sell of the bigger MAs highlights the tension perfectly. Short-term, we're kind of drifting, but longer-term, it's still ugly. The Bitcoin forecast 2026, if you're leaning on these traditional indicators, is still pretty bleak until those big numbers get touched again. These numbers don't lie, they just don't tell the full story on their own. The market needs a lot more steam than it has right now to climb that mountain again.
Pivot Points and Volatility: Playing the Edges
Alright, let’s talk about the immediate playing field. Pivot points give us some lines in the sand for short-term moves. Today, Bitcoin sits right between the Woodie Pivot (P=67683.7) and its R1 (68924.26). For Camarilla, it's wedged between S1 (67834.2) and R1 (68171.96).
This tells you something important: we're in a tight zone. The bulls and bears are duking it out on a very narrow battlefield right around the current price. There's not a lot of conviction for a huge move in either direction right now, according to these. But don’t let that fool you. The "Volatility" is High, with an ATR% of 4.6582. This isn’t some sleepy stock; Bitcoin still whipsaws like a maniac. You can tinker with these levels yourself on a proper charting tool.
High volatility when the signal is a "Sell" means those small "Buy" signals from the oscillators could lead to quick gains, or brutal losses if they don't hold. It’s a gambler's paradise, or a seasoned trader’s nightmare. You can make money on these swings, but you better be quick, and you better have some clear stop-losses. This Vunelix post isn’t just for fun, it's for thinking. This kind of market eats people alive who don't pay attention to the details.
A Long Road Back to the Top
Look, the raw numbers are stark. Bitcoin is down 40.3205% over the last six months. It’s sitting miles below its one-month high of 91137.33, let alone its all-time high of 126230.09. That’s a long, long way to go just to break even for anyone who bought at the peaks. The overall crypto market, you can see here, isn't exactly painting a picture of universal euphoria.
When the long-term moving averages are screaming "Strong Sell" and the price is nowhere near challenging them, it just confirms what the performance numbers show: this asset is in a serious struggle. It’s not just a momentary slump; it’s going to take a significant catalyst, or a long, slow grind, to turn this battleship around. Until then, you got to respect the numbers, even when they’re confusing as hell.
So, considering these wildly conflicting signals – a strong sell overarching signal, bullish short-term oscillators, and brutally high long-term resistance – is Bitcoin in February 2026 really a buy, or are we still in for more pain?


