
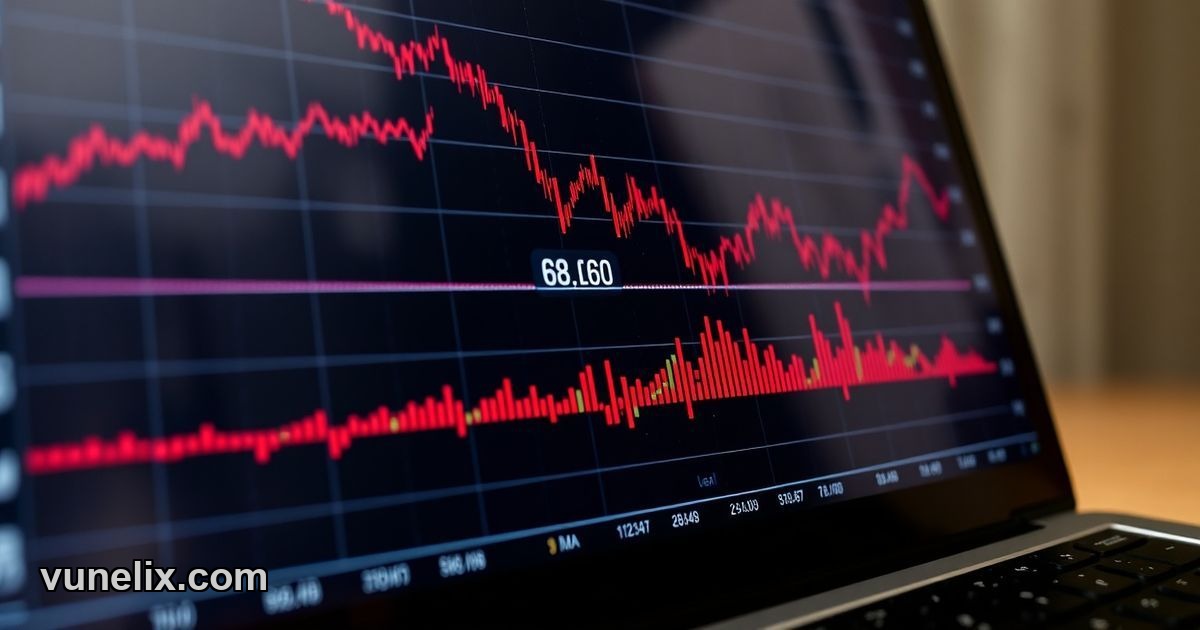
$68,609. That's where Bitcoin sits right now — up half a percent from open, looking bullish on the surface. But the signal? Strong Sell. That contradiction isn't noise. It's the entire story of what's happening in Bitcoin / TetherUS right now, and an AI trading assistant picks up these divergences faster than most traders notice them.
The price action says one thing. The oscillators say another. And the moving averages? They're screaming a third message entirely. This is what happens when Bitcoin sits in no-man's-land — not crashing, not rallying, just grinding while every indicator throws up different flags.
Bitcoin / TetherUS Price Today: Signal vs Reality
Open was $68,284. Current price $68,609. That's a +0.476% move. Bullish price action. The chart looks fine. Nothing dramatic. But the composite signal reads Strong Sell.
Why? Because price action is just one input. The signal weighs oscillators, moving averages, momentum, volume. And right now most of those are tilted bearish even while price inches up. It's like watching a car accelerate while the engine warning light flashes red.
ADX at 15.57 says Strong Buy. That's an outlier. ADX measures trend strength, and a reading this low usually means no strong trend exists. So why Strong Buy? Because ADX below 20 often precedes breakouts — the calm before volatility spikes. It's not saying "buy because trend is strong" — it's saying "buy because a trend might be forming."
Then you hit MACD. Level at -732.297. Strong Sell. MACD tracks momentum, and this negative reading shows bearish pressure building under the surface. Price might tick up, but momentum is leaking out. That's the warning.
Bitcoin / TetherUS Buy or Sell: What Moving Averages Say
Every major moving average is above current price. SMA 25 at $69,654. SMA 100 at $77,473. Both flash Strong Sell. SMA 10 sits at $68,406 — basically neutral, just $200 below spot.
When short-term MAs hover near price but medium and long-term MAs sit far above, that's a downtrend with brief pauses. Bitcoin rallied hard in late 2024, hit $126,199 all-time high. Now it's down 43% over six months. The MAs haven't caught up yet. They're still elevated from that peak.
This creates resistance. Every time Bitcoin tries to push higher, it runs into these descending averages. The best AI trading assistant 2026 models factor this in — not just current price, but how much overhead supply sits waiting above.
Bollinger Bands middle at $69,654 — same as SMA 25. Price position 34.19%. That means Bitcoin is closer to the lower band than upper. Not oversold, but sitting in the bottom third of its recent range. Squeeze reads Normal. No compression, no expansion. Just a steady grind.
Bitcoin / TetherUS Support and Resistance Levels
Demark pivot points give structure. R1 at $69,729. S1 at $67,138. Pivot at $67,863.
Current price $68,609 sits between the pivot and R1. That's a narrow band. If Bitcoin breaks above $69,729, next stop is likely retesting those moving averages around $69,654-$70,000. But resistance is thick there. SMA 25, Bollinger middle, round number psychology — all stacked in that zone.
Downside support at $67,138. Below that, $67,000 psychological level. Then you're looking at $65,000 if momentum really breaks. The pivot at $67,863 acts as a fulcrum. Price above it, slight bullish tilt. Below it, bears take over.
Right now Bitcoin is $746 above the pivot. Not much cushion. One bad day erases that gap.
Bitcoin / TetherUS Forecast 2026: Oscillator Clash
ADX Strong Buy. MACD Strong Sell. Ultimate Oscillator Neutral at 44.84. Three oscillators, three different answers.
This is what whipsaw looks like in data form. ADX says volatility might spike soon. MACD says when it does, direction is probably down. Ultimate Oscillator — which blends short, medium, and long-term momentum — sits right in the middle, undecided.
When oscillators conflict this hard, the market is either transitioning or stuck. Bitcoin's six-month performance at -43% suggests the latter. Not a clean downtrend. Not a recovery. Just bleeding slow.
The all-time high at $126,199 feels like ancient history. Price is almost half that. The longer Bitcoin sits in this range, the more traders lose conviction. Volume dries up. Breakouts fail. That's when the best AI trading assistant tools earn their value — they don't get bored, don't get frustrated, just keep watching for the setup that actually works.
Bitcoin / TetherUS Analysis: Volatility and Volume Context
Bollinger squeeze reads Normal. Not tight, not wide. That means recent volatility is average. No compression phase building pressure. No expansion phase showing follow-through.
In crypto, normal volatility usually means sideways chop. Big moves come from extremes — either bands squeezing tight (breakout pending) or bands stretching wide (momentum exhausted). Bitcoin has neither right now.
Six-month performance at -43% shows the bigger picture. This isn't a dip. It's a correction that stretched into a grind. The kind of move that burns out both bulls and bears. Bulls who bought the dip at $90,000 got wrecked. Bears who shorted at $70,000 barely made anything.
SMA 100 at $77,473 is $8,863 above current price. That's 12.9% away. For Bitcoin to reclaim that average, it needs sustained buying. Not a quick squeeze. Actual accumulation. Right now there's no sign of that.
Bitcoin / TetherUS Prediction: Strong Sell Signal Breakdown
The composite signal weighs everything — oscillators, MAs, momentum, pattern recognition. Strong Sell doesn't mean Bitcoin crashes tomorrow. It means the probabilities tilt bearish.
Price could rally to $70,000. Could even hit $72,000 if a short squeeze fires. But the path of least resistance is down. MACD negative. Moving averages overhead. Six-month trend still down. Bollinger position in lower third.
ADX says watch for a breakout. MACD says when it comes, fade the rip. Ultimate Oscillator says maybe wait and see. The signal synthesizes all this into: Strong Sell. Not because Bitcoin is doomed, but because the setup favors sellers over buyers.
If you're long from $60,000, you're up. If you're thinking of buying here, the signal says wait. If you're short, the setup supports that trade more than the alternative.
Bitcoin / TetherUS Target Price: Where Next?
R1 at $69,729 is first resistance. Above that, SMA 25 at $69,654 (yes, R1 is actually above the MA — Demark pivots don't always align perfectly with MAs, they use different math). Then $70,000 round number. Then $72,000 if momentum really builds.
Downside targets: S1 at $67,138. Then $67,000. Then $65,000. Then $63,000 where some old support sits from earlier in the year.
The crypto trading tools on Vunelix don't predict exact prices. They track probabilities. Right now the probability distribution is skewed toward the $65,000-$67,000 range before any sustained move higher.
Could Bitcoin rip to $75,000 tomorrow? Sure. Crypto does that. But the odds don't favor it. The signal reflects that. Strong Sell isn't a guarantee. It's a weighted assessment of where the math points.
Bitcoin / TetherUS Outlook: What the Data Actually Says
Bullish price action. Strong Sell signal. That's not a glitch. It's what happens when short-term momentum diverges from medium-term structure.
Price up today, but MACD negative, MAs overhead, six-month trend down. The rally from open to current price is a bounce within a larger range. Not the start of a new trend.
ADX at 15.57 is the wild card. When ADX is this low, big moves often follow. But which direction? MACD says down. MAs say down. Price action says maybe up