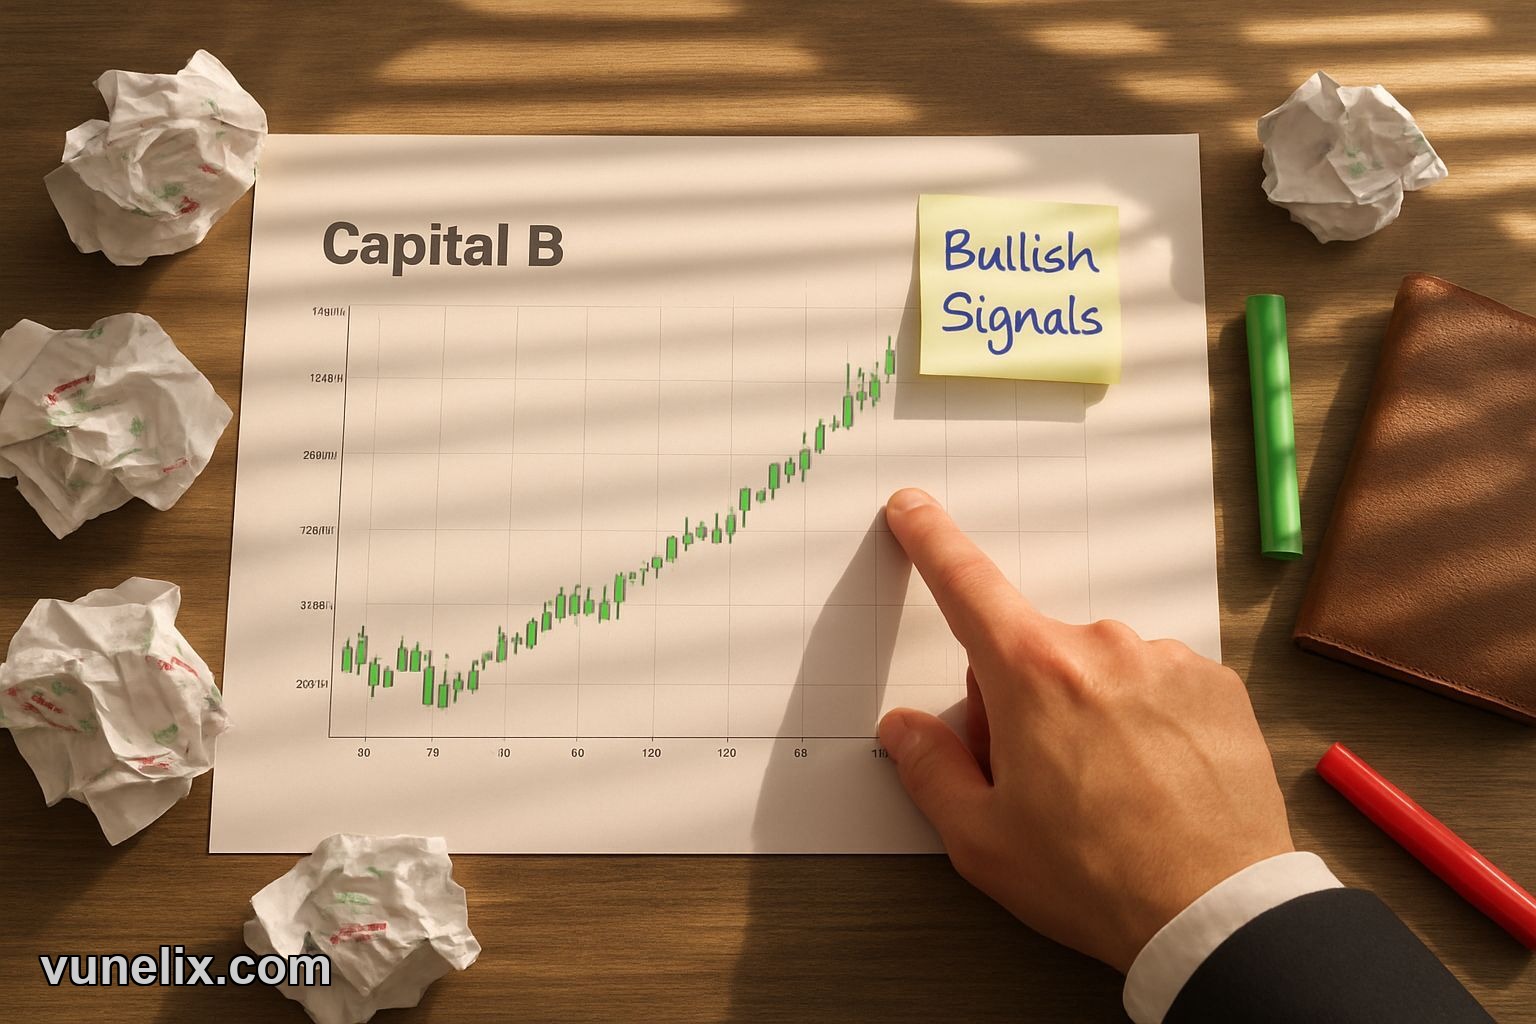
Today's market data shows Capital B (ALCPB) with a price of 0.827, up 11.606% from its open. The signal is neutral, but the price action is bullish.
Signal vs Price Action
The Ultimate Oscillator is at 55.0452, indicating a neutral signal, while the RSI is at 65.4732, suggesting a sell signal. However, the ADX is at 29.7732, which is a strong buy signal.
The moving averages are also showing conflicting signals. The SMA 200 is at 1.75315, indicating a strong sell, while the SMA 100 and EMA 10 are at 0.79156 and 0.732264, respectively, indicating strong buy signals.
Pivot Points and Bollinger Bands
The classic pivot points show a resistance level at 0.8137 and a support level at 0.7387. The Demark pivot points show a resistance level at 0.8005 and a support level at 0.7255.
The Bollinger Bands are at a middle value of 0.65552, with a position of 84.4% and a normal squeeze.
Visit our free stock screener for more information on Capital B and other stocks.
The volatility is high, with an ATR% of 8.649. The 1W performance is at 34.5161%, and the all-time low is at 0.066135.
For more analysis and forecasts, check out our blog and free advanced charting tool.