A 17% jump sounds great until you check where it started. GAIA CORPORATION CO. LTD opened at 352 this morning — which was also the one-month low — and pushed to 412 by close. That's not strength. That's a dead cat bounce from a basement level.
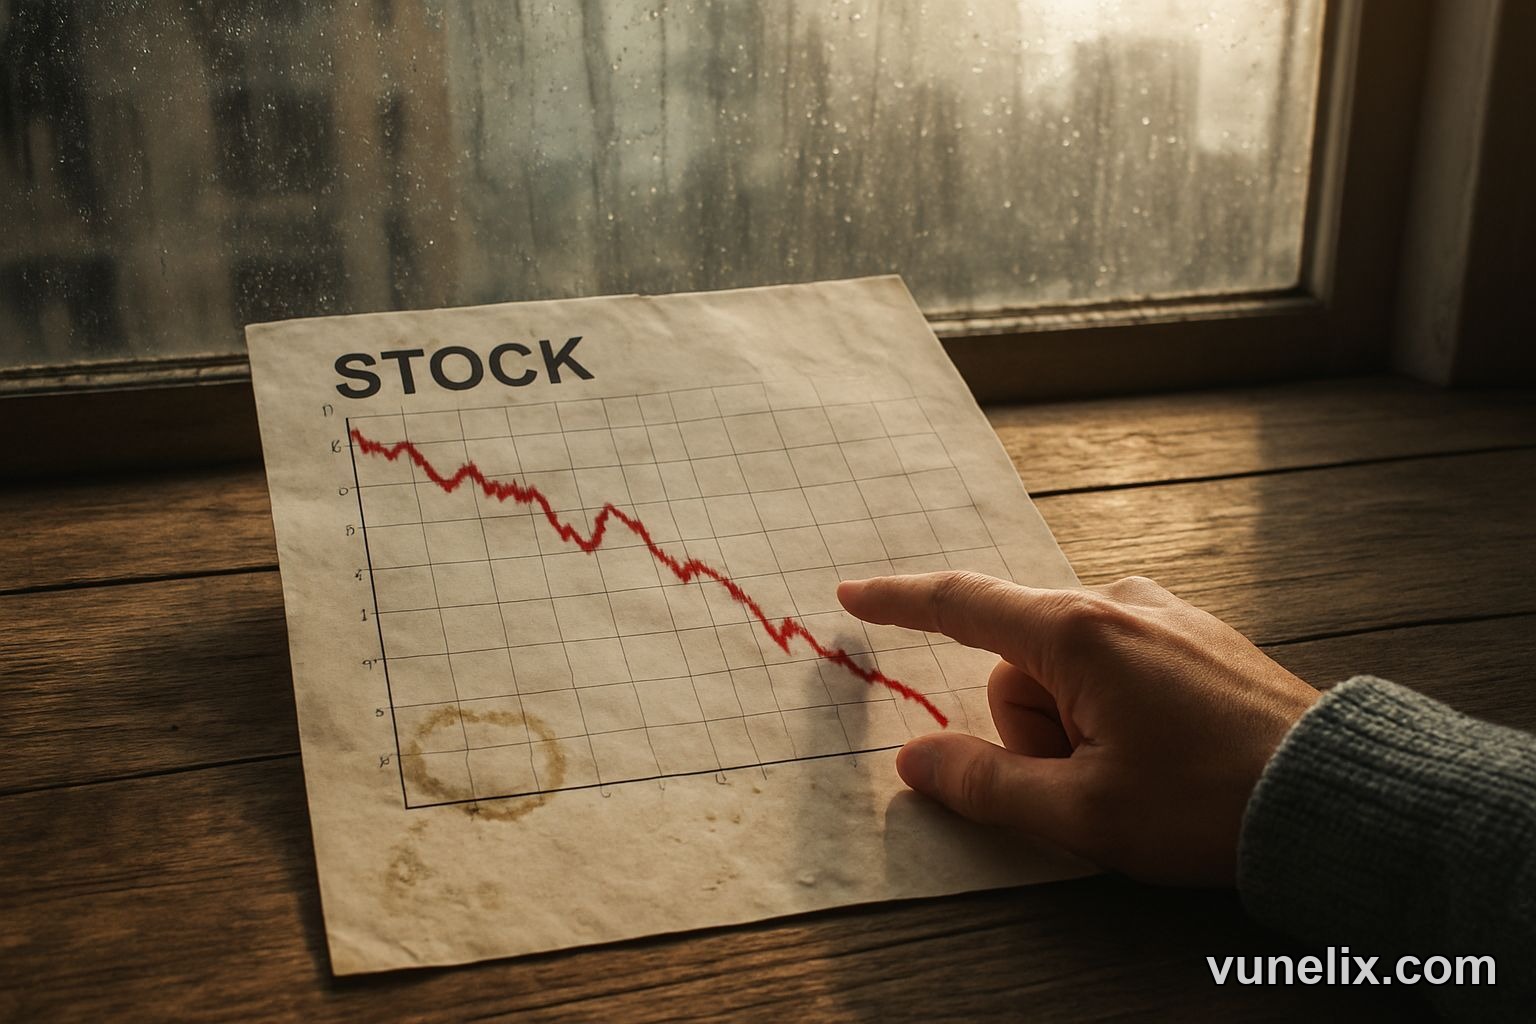
The stock's down 18.9% over the past week. The all-time high sits at 6830. We're at 412. Do the math. This isn't a dip. It's a crater.
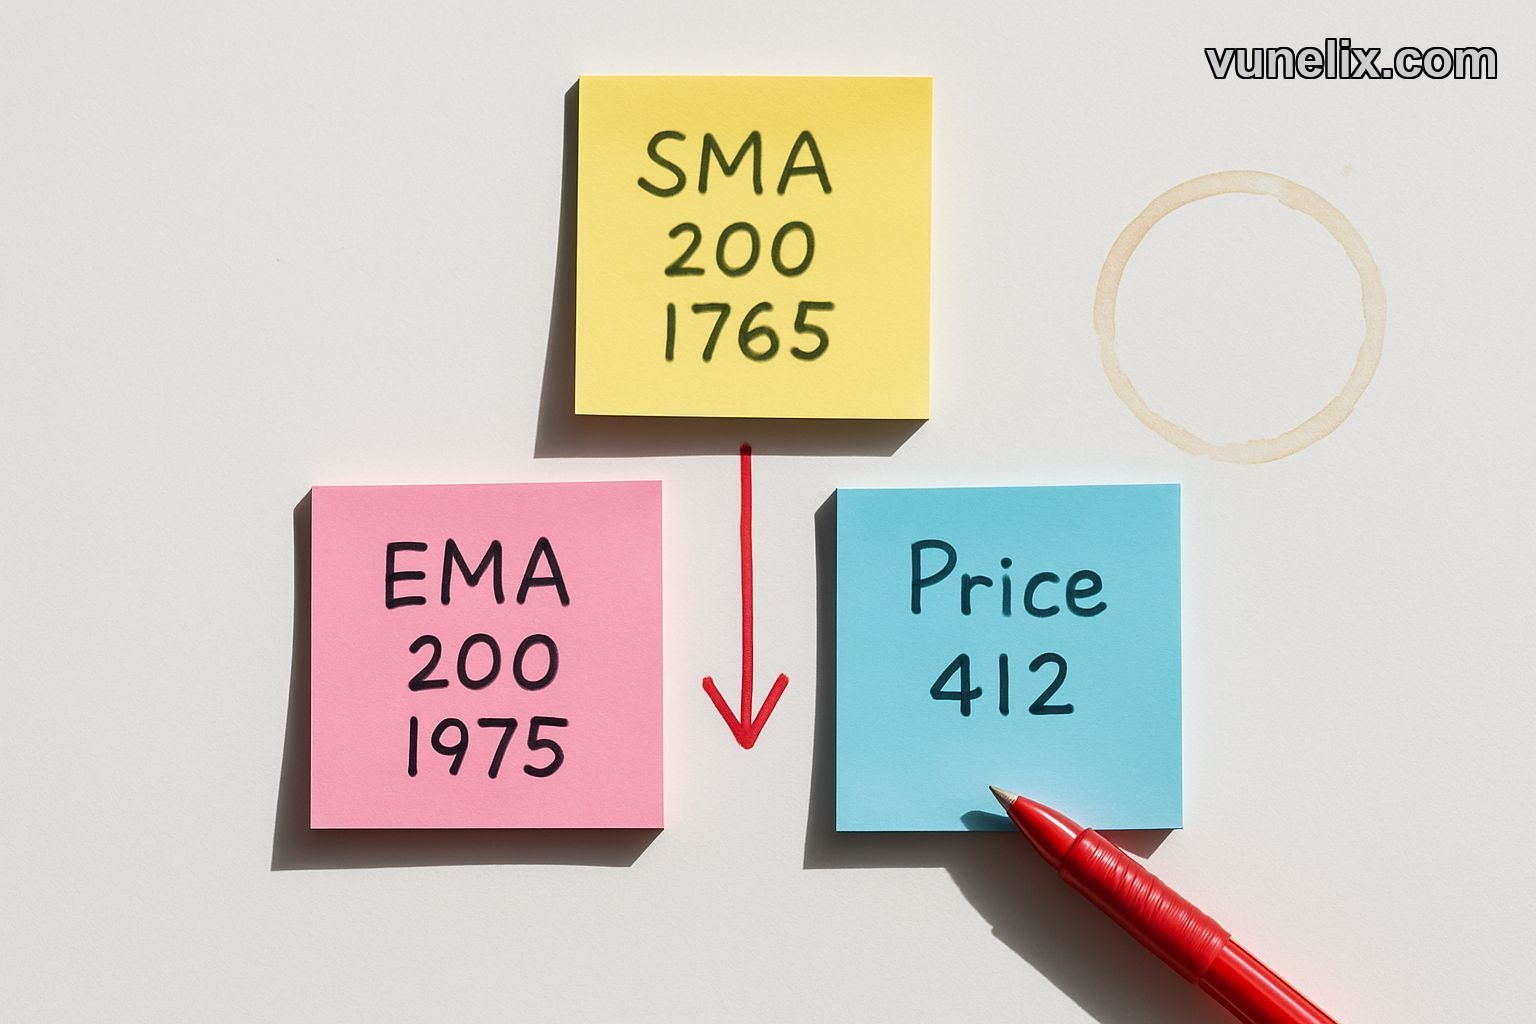
Every Moving Average Points Down
The 200-day simple moving average is at 1765. The 200-day exponential is at 1975. Current price? 412. That's not even close. When you're trading 75% below your long-term averages, you're not "finding support" — you're in freefall with occasional pauses.
The 10-day EMA sits at 518, which means even the short-term momentum is bearish. The stock briefly touched that level recently and got rejected hard. Now it's back down, and the stock screener data shows no signs of a reversal pattern forming.
I've traded enough Korean small caps to know this setup. The brief spike today probably trapped a bunch of retail buyers who saw the percentage gain and thought they were catching a bottom. They weren't.
RSI Says Buy, Everything Else Says Run
The RSI is at 39.5, which technically signals a buy. The ADX is at 11.3, also leaning bullish. But here's the problem — both of those are weak trend indicators when the price action is this broken.
The Parabolic SAR is at 836. That's almost double the current price. It's screaming Strong Sell. Bollinger Bands have the middle at 613, and we're only 11.5% through the band width. That means we're hugging the bottom, with tons of room to fall further if selling pressure continues.
Volatility is high — ATR percentage is over 30%. That's not a sign of healthy consolidation. That's chaos. Wild swings in both directions, no clear structure, no institutional buying pattern visible in the tape.
Pivot Points Don't Save This
Woodie pivots have resistance at 476 and support at 348. Classic pivots show R1 at 497 and S1 at 369. We're sitting between support levels after bouncing off 352 — the monthly low.
Here's what worries me. If 352 breaks, there's nothing underneath. No prior consolidation zone, no volume shelf, no logical place where buyers would step in aggressively. The free charting tool shows a void below current levels that could easily take this stock under 300.
Resistance at 476 and 497 looks solid because the stock got rejected there recently. Those are areas where sellers unload into any strength. Not the kind of overhead you want when momentum is already broken.
What About That All-Time High
6830. That's where GAIA peaked. Now we're at 412. I'm not going to sugarcoat this — getting back to even half that level would require a complete business turnaround, multiple quarters of positive catalysts, and a market environment that favors risky Korean equities. None of those things are happening right now.
Some traders look at a 94% drop and think "value opportunity." I look at it and think "there's usually a reason." Companies don't lose 94% of their value because Mr. Market was having a bad day. They lose it because something fundamental broke.
The Setup I'm Watching
If you're stubborn enough to play this, here's the only scenario that makes sense. Wait for a clean break and hold above 518 — the 10-day EMA. You'd need volume to confirm it, not just a spike. Then watch for a retest that holds. That would be the earliest sign that maybe, just maybe, the selling exhaustion is real.
But I'm not holding my breath. The broader market shows plenty of beaten-down names that at least have bullish divergences forming. GAIA doesn't even have that. It's just down, with no structural evidence of a turn.
The Strong Sell signal isn't just one indicator throwing a tantrum. It's the composite picture — the distance from moving averages, the breakdown below pivot support levels, the lack of institutional accumulation, the high volatility without follow-through. These all point the same direction.
My Take
I wouldn't touch GAIA at 412. The 17% bounce feels like a trap. You're buying into a falling knife with rusty handles. Yeah, the RSI is oversold. So what? It can stay oversold while the stock drops another 20%.
If this were a US large cap with analyst coverage and earnings visibility, maybe I'd consider a small speculative position. But a Korean small cap down 94% from highs, trading at monthly lows, with every major moving average in Strong Sell territory? Pass.
I've been wrong before. Maybe this is the exact bottom and I'll look stupid in three months. But I'd rather miss a potential bottom than catch a falling anvil. The risk-reward here is awful. Too much downside, too many resistance levels overhead, not enough evidence that buyers are stepping in with real conviction.