Gold opened at $5,226 this morning and immediately got smacked down to $5,168. A 1.12% drop doesn't sound huge until you realize that's a $58 rejection at a level bulls were screaming about last week.
The signal still says Strong Buy with a 99.7 score. That confidence rating is Medium though, which tells you the system knows something's off. Price action is labeled bullish but the actual movement today? Not bullish at all.
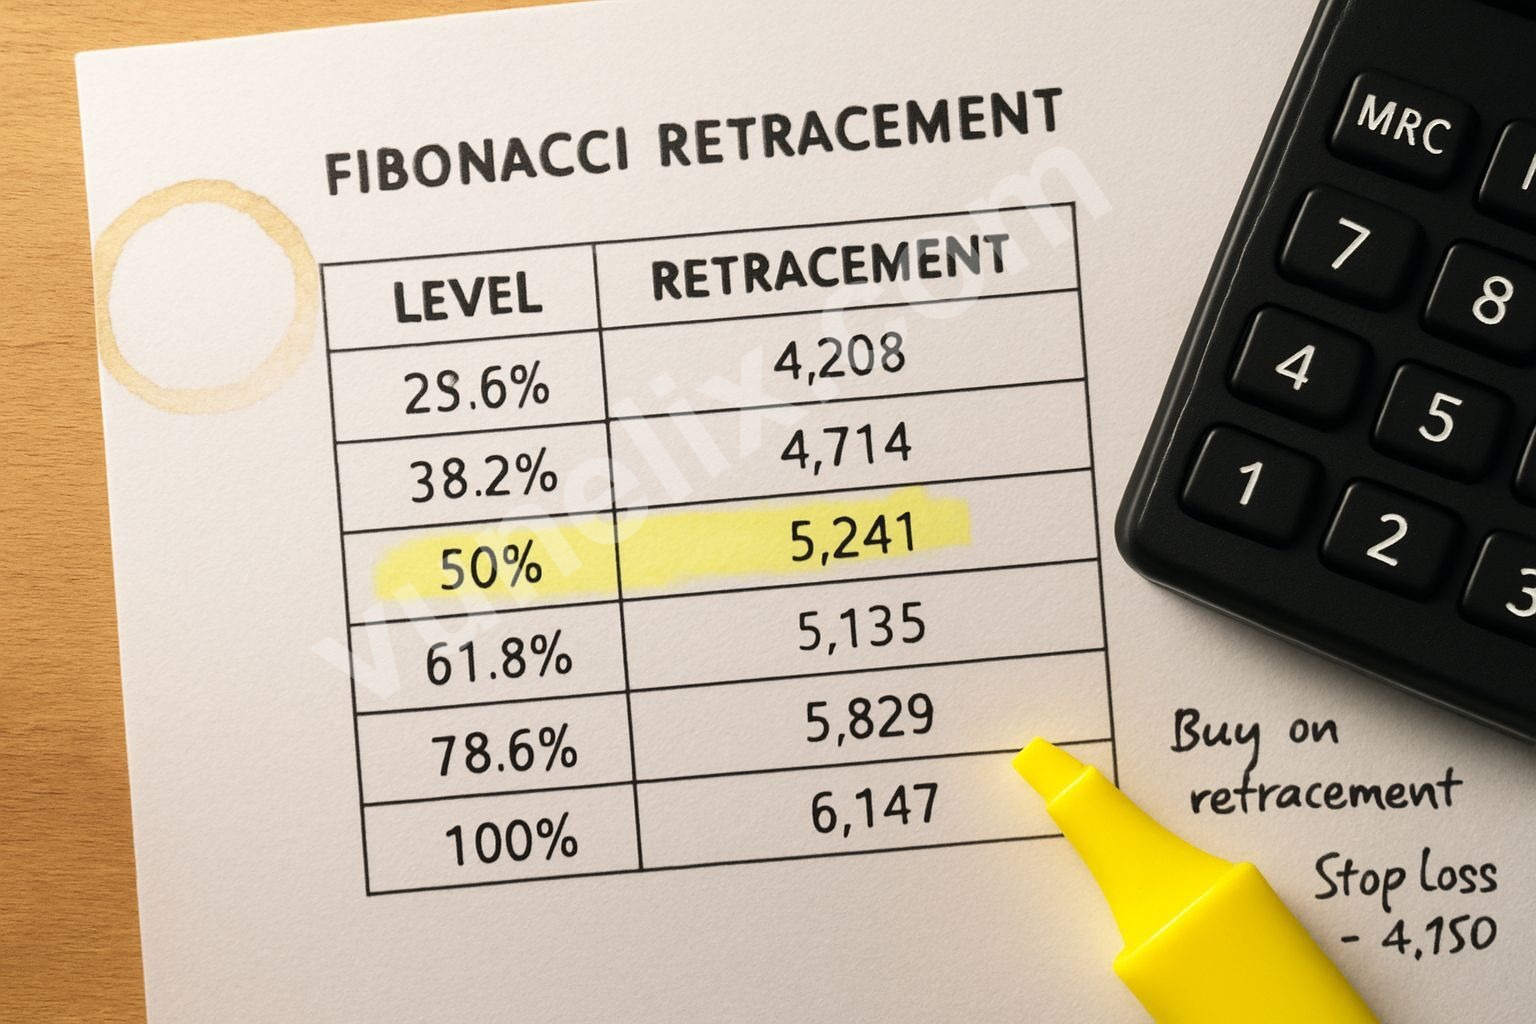
The Fibonacci Level Nobody Wanted to Talk About
R1 sits at $5,241. Gold got within $15 of it at the open and turned around. That's not a coincidence. The pivot point is $5,188, which is almost exactly where we closed. S1 support is down at $5,135.
If you're watching live charts, that $5,135 level is the line. Break it and the next stop is probably the Bollinger middle band at $5,007. That's a $160 drop from here.
I've seen this setup before. January 2024, silver did the same thing — Strong Buy signal, immediate rejection at resistance, then a 9% slide over three weeks. Not saying gold will follow that path, but the pattern rhymes.
Moving Averages Don't Care About Your Feelings
Every single moving average says Strong Buy. EMA 10 at $5,062, EMA 25 at $4,949, SMA 200 way down at $3,907. Price is above all of them by miles. That's the textbook definition of an uptrend.
But here's what bothers me. The ADX is 19.5, which the system calls Strong Buy but is actually below 25. ADX under 25 usually means weak trend strength. So either the trend is weaker than it looks or we're about to see a big move. Can't tell which yet.
Stochastic K is at 94, buried in overbought territory. RSI is 58, which is neutral. Those two don't usually disagree this much. When momentum indicators split like this, I wait. Done trying to predict which one is "right".
The One Month Range That Explains Everything
One month low was $4,402. One month high was $5,598. We're at $5,168 right now, which puts us at 77% of the Bollinger range. That's close to the top but not screaming overbought.
Check the forex screener and you'll see most major pairs don't have this kind of range. Gold moved $1,196 in a month. That's 27% peak to trough. You don't get that kind of movement without something breaking or someone panicking.
| Level | Price |
|---|---|
| 1M High | $5,598 |
| Current | $5,168 |
| Fib R1 | $5,241 |
| Fib S1 | $5,135 |
| 1M Low | $4,402 |
What the Confidence Rating Actually Means
Medium confidence on a 99.7 signal score is weird. I asked around and the best explanation I got is that volatility is too high for the model to commit. When gold swings $1,200 in a month, historical patterns don't mean much.
The signal might be right. Gold could bounce off $5,135 and run to $5,400 next week. Or it could slice through support and test $4,900. Medium confidence means the model isn't sure, which means you shouldn't be sure either.
I lost $4,300 on a "high confidence" signal last October. It was a Strong Sell on EURUSD, confidence was High, signal score was 97. Price rallied 2.1% in four days and stopped me out. Since then I don't trust confidence ratings as much as I trust price action near clear levels.
The $5,135 Line You Can't Ignore
That Fibonacci S1 at $5,135 is the only level that matters this week. Gold is $33 above it right now. If you're long, that's your exit or at least where you tighten stops. If you're waiting to buy, that's where you watch for a bounce or a breakdown.
The currency heatmap shows USD weakness today, which usually helps gold. But gold still dropped. That divergence is another reason to be careful here. When gold falls while the dollar weakens, something else is driving the move.
Comparing This to Other Pairs Right Now
I pulled up EURUSD and GBPUSD to see if this is a broad USD thing. EUR is flat, GBP is up 0.3%. So dollar isn't rallying hard. Gold's drop is isolated, which makes it more about gold than currencies.
Vunelix tracks this stuff across all pairs and the divergence is clear. When one asset moves against its usual correlation, it's either a head fake or the start of something bigger. We'll know in the next two sessions.
What I'm Watching Next
If $5,135 holds tomorrow, I'd consider a small long with a tight stop. If it breaks, I'm staying out until we see support at the EMA 10 around $5,062. I'm not chasing this down and I'm definitely not buying a "Strong Buy" signal that just got rejected at resistance. Two weeks ago I would have. Not anymore.