3558. That’s the number, down from an open of 3590. It’s a small drop, less than a percent, but the story isn't in the daily change. It’s in the war between two lines on a chart.
The Bull vs. Bear Tug-of-War
The signal says weak buy. The trend is strong and price action bullish. But look at the oscillators and short-term averages – they're screaming sell. Parabolic SAR at 3817 is a strong sell. The EMA 10 at 3665 agrees.
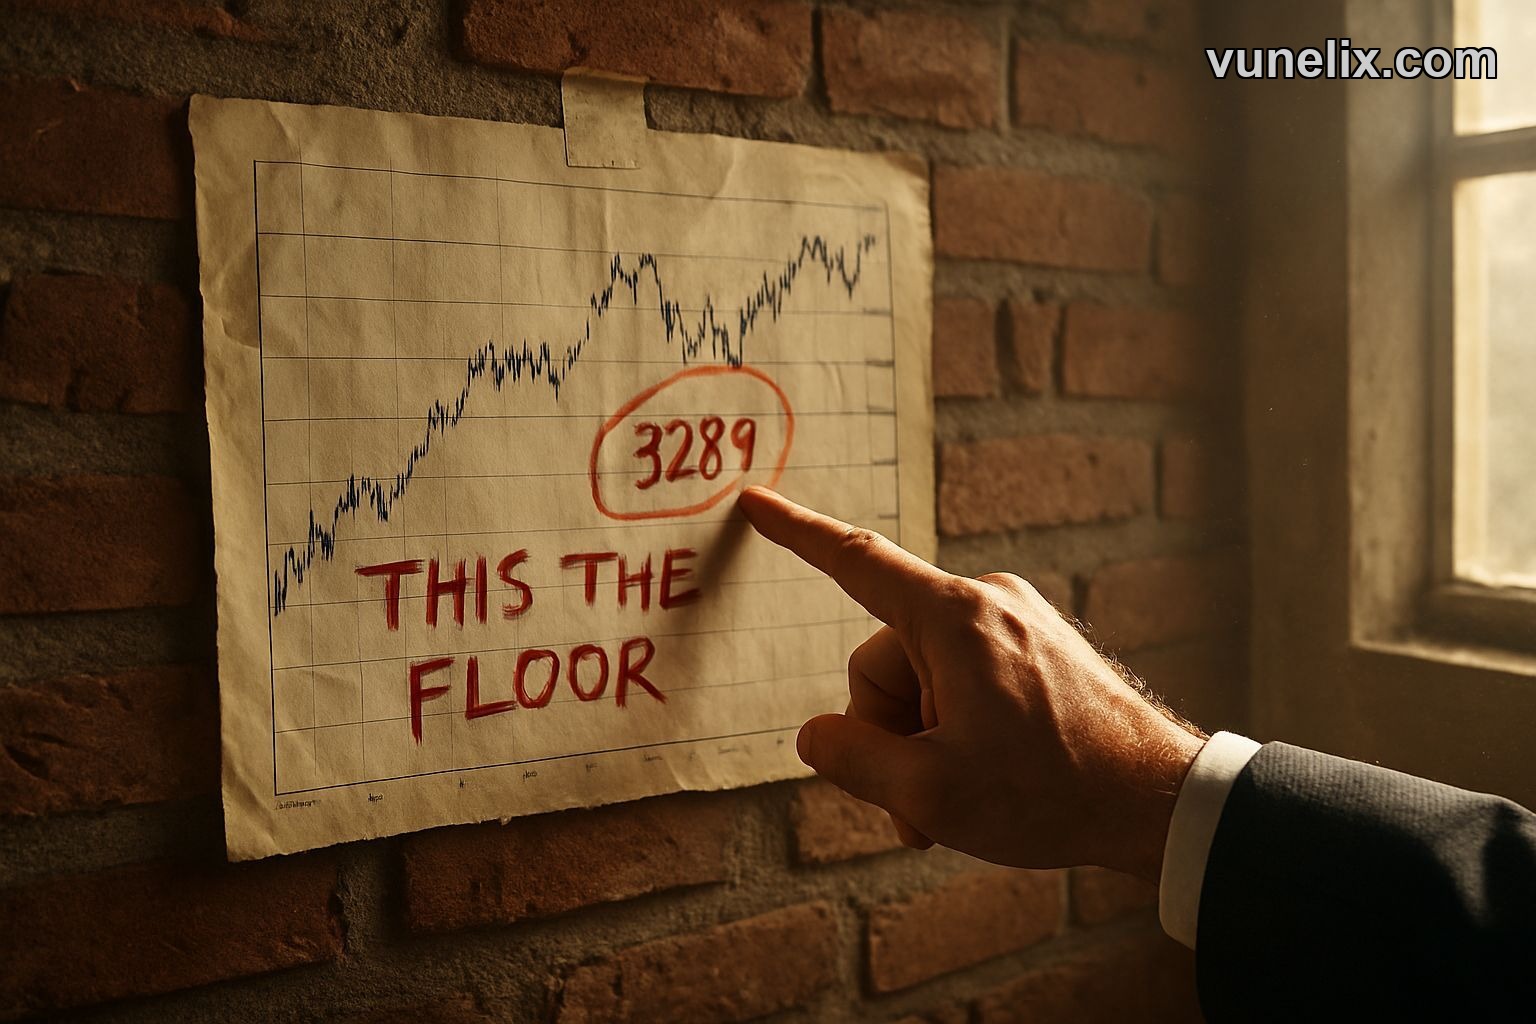
Then you have the EMA 100 sitting at 3289, flashing a strong buy signal. That’s a massive gap, over 250 points from the EMA 10. The market can't decide if this is a pullback or the start of something worse.

Here’s what matters right now:
- Price: 3558
- EMA 100 (Strong Buy): 3289
- Classic Pivot Support (S1): 3530
The immediate floor is S1 at 3530. Break that, and the real test begins all the way down at that strong buy zone near 3289. That’s your line in the sand.
Why Volatility Changes Everything
The Bollinger Bands show a normal squeeze, but don't be fooled. The Average True Range percentage is over 3.2%. That’s high volatility for an equity like this.
It means moves are bigger, faster. A trip from here to that 3289 support isn't a gentle slide – it's a potential plunge. But that high volatility also means the snap back up, if it holds, could be just as violent.
The all-time high is 4128. We're roughly 14% off that peak. The six-month performance is still positive at over 17%. This isn't a broken stock; it's one caught in a nasty correction.
The One Trade Setup
I'm bearish until proven otherwise. The weight of the short-term indicators is too heavy to ignore.
The trade is simple: watch S1 at 3530. A clean break and close below that on the daily chart opens the path to test the EMA 100. That's where I'd look for a potential long entry, not here.
Buying now is fighting both the SAR and the EMA 10. That's a bad bet.
Use tools like our free stock screener to find names with cleaner setups, or advanced charts to plot these levels yourself.
MOL Hungarian Oil & Gas Plc Class A Outlook for 2026
The prediction hinges on one thing: does it hold the hundred-day average? If it finds footing there, the bullish structure from last year remains intact for a run back toward old highs later in '26.
If it slices through 3289 like butter, forget it – something fundamental has shifted. For now, the market is giving you levels, not opinions. Trade them.
The price will find its direction at 3289.