
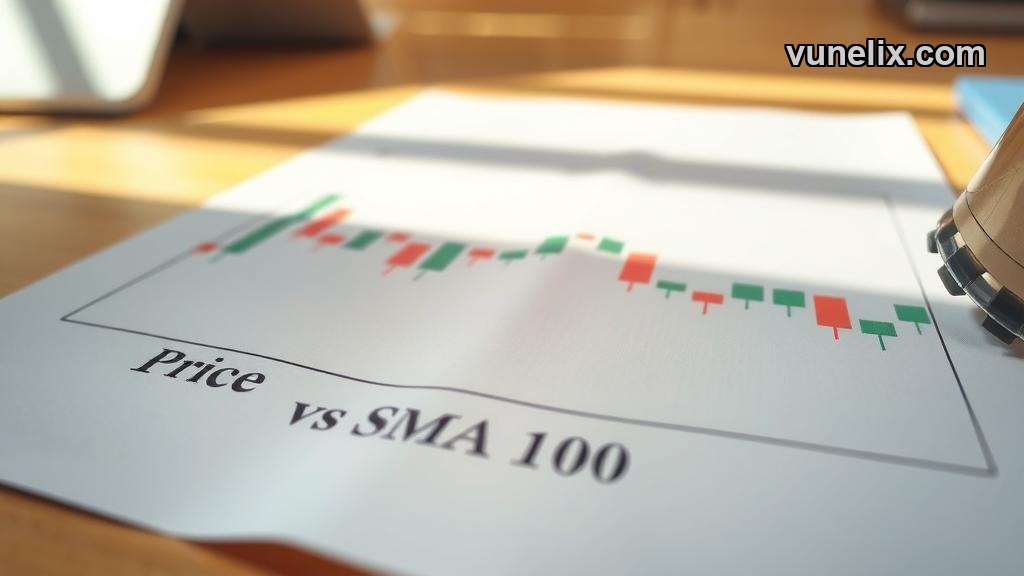
$185.84. That's where NVIDIA closed today, March 10th. Up 1.89% from open. Sounds good until you see it's basically sitting right on top of the 100-day SMA at $185.836. Not above it. Not below it. Right on it.
I've seen this setup before. Price hugs a major moving average, everyone thinks it's consolidating for a breakout, then it just.. doesn't. Sometimes for weeks.
The Signal Problem
Vunelix gives NVIDIA a "Buy" signal with medium confidence. Signal score is 34.7. That's not great. Medium confidence means the system isn't sure either.
Look at the oscillators. ATR says buy. Stochastic K% at 32.47 says buy. Makes sense — oversold bounce territory. But MACD Level sits at -0.9317 flagged as "Strong Sell". That's not a disagreement, that's a fight.
When momentum indicators can't agree, I don't force a trade. The 200-day SMA at $176.65 shows "Strong Buy" because price is above it. EMA 10 at $183.59 also says "Strong Buy". So trend says up, momentum says down. Great.
What the Moving Averages Actually Say
Price is $185.84. The 100-day SMA is $185.836. That's a four-cent difference. In percentage terms, that's nothing. When price sits this close to a major average, it's not trending — it's deciding.
The 200-day at $176.65 is nearly $10 below current price. That's support if things break down. Not comforting when you're trying to decide if this is going higher.
EMA 10 at $183.59 is below current price, which is bullish short-term. But here's what bugs me: we're sandwiched between the EMA 10 and SMA 100 in a narrow $2 range. That's compression. Something breaks soon.
Pivot Points Nobody Checks
Camarilla pivot: R1 at $183.32, S1 at $181.98, pivot at $182.65. We're above all of them. That's technically bullish intraday positioning.
Fibonacci pivot: R1 at $183.18, S1 at $177.57, pivot at $180.37. Again, we're above. But these levels are backward-looking. They tell you where the range was, not where it's going.
I don't trade pivots alone. They're useful for watching intraday zones, but when your MACD is screaming sell and pivots say you're in good shape, one of them is lying.
The One-Month Problem
One-month high was $197.63. We're at $185.84 now. That's a $12 drop — about 6% off the recent peak. Six-month performance? Up 3.55%. So we rallied, gave most of it back, and now we're stuck.
This isn't a runaway bull move. This is a stock that went too far, pulled back, and now can't decide what's next. The most active stocks list is full of names like this right now — big moves in both directions, no clear winner.
What I'd Do Here
If I owned NVIDIA from lower, I'd hold but watch that 100-day SMA close. A break below $185 on volume means the bid is gone. If you don't own it, I wouldn't chase here. Medium confidence buy signal with a strong sell MACD is a coin flip.
The better play: wait for a clear break above $188 or a pullback to $182. Right now it's just noise. ATR at 6.31 tells you the average true range is about $6 — so this thing can move $6 in either direction on any given day without meaning anything.
Stochastic K% at 32.47 suggests there's room to run if momentum shows up. But momentum hasn't shown up. That's the whole problem. You can't trade what "should" happen. You trade what is happening, and what's happening is nothing.
Why This Matters for March
We're ten days into March. If NVIDIA can't break $188 by mid-month, I'd expect a retest of $180 or lower. The longer it sits here, the more likely sellers show up. Buyers had their chance at $182 open today — they pushed it to $185.84 and stopped. That's not strength.
The 200-day SMA at $176.65 is your real support. If we get there, that's where I'd look to compare setups across other tech names. But hoping NVIDIA holds $185 because it's "supposed to" is how you lose money in a sideways market.
March 2026 NVIDIA forecast: I expect another test of $180 before any real move higher, and the $186 level everyone's watching turns into resistance, not support.

