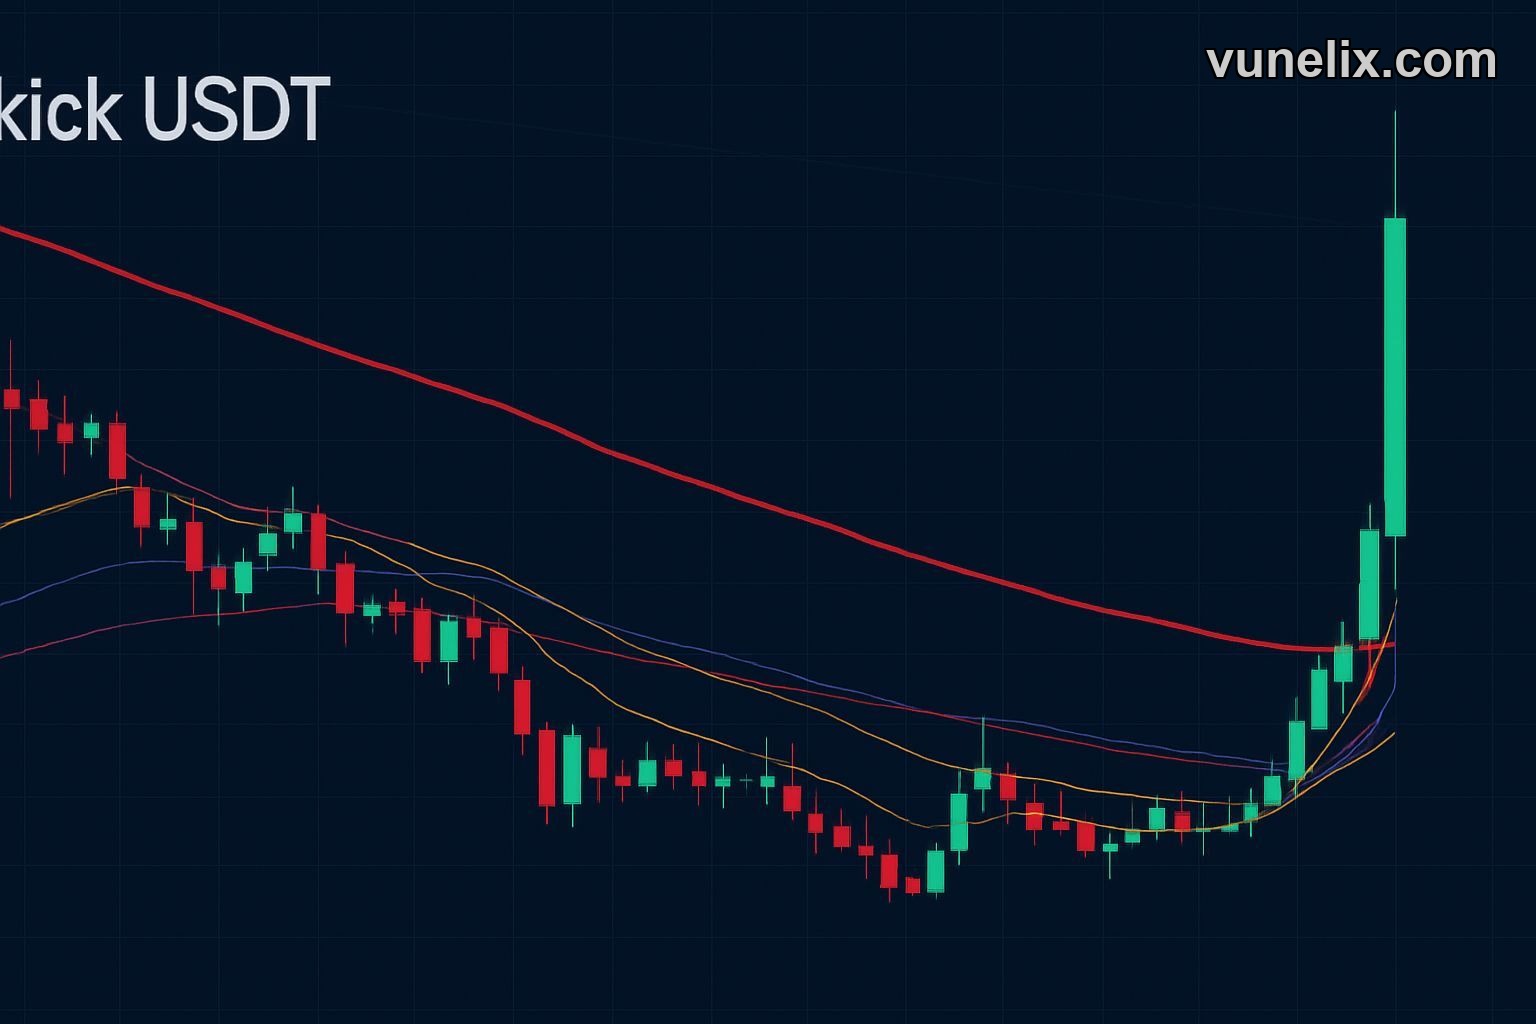
You see a pump like what Sidekick / USDT just pulled, jumping almost 58% in a day, and the FOMO siren starts blaring. Seriously, a +57.939% change, price hitting 0.002467? February 25, 2026, and KUSDT is on fire, right?
That open at 0.001562 seemed a million miles away, didn't it? Everybody's probably high-fiving, talking about how they "called it" or how they "knew this was coming." The price action is officially bullish, and a Hammer candle pattern just printed. Smells like rocket fuel.
The Big Pump, and The Big "Hold On"
It's easy to get caught up in that kind of green. A nearly 58% swing, wow. People dump everything into these kinds of moves. Thinking this is the breakout, the one they've been waiting for. They see that current price, 0.002467, and forget everything else. It looks good on paper, absolutely.
But Vunelix isn't about blind optimism. You gotta look deeper than just the headline number. That kind of jump, especially when it comes after the price has been hovering around the 1M low of 0.001408, often screams "dead cat bounce" louder than it whispers "bull run."
The trend? It's strong. Strong what, though? That's the question. Just because something is moving with force doesn't mean it's moving where you want it to go. I've been burned by those strong moves before. Bought into a crypto that looked like it was taking off, only for it to collapse hard. Lesson learned.
Underneath the Hood: Conflicting Signals
So, the surface looks great, right? +57.939% change. Hammer candle. Bullish price action. But let's peel back a layer. The signal score for KUSDT right now? It's a nasty -55.6. Yeah. That's a pretty strong "Sell" right there. A hard counter to the euphoria.
And then you look at the oscillators. Things get confusing, real fast.
- Stochastic K%: 10.8324 (Strong Buy)
- MACD Level: -0.0007 (Sell)
- Ultimate Oscillator: 53.9729 (Neutral)
One indicator screams "Strong Buy" while another immediately hits you with a "Sell." That's not the kind of harmony you want to see if you're piling into a trade. It feels like the market is throwing darts at a board right now, just hoping something sticks. For a deeper dive into crypto, sometimes you need a different perspective. Check out our free crypto screener.
What the Moving Averages Are Really Saying
The moving averages are even more stark. It's like they're living in two different universes. The short-term SMA 10 is at 0.0019768, screaming "Strong Buy." That makes sense, given the daily pump. People chase these short bursts.
But the long game? That EMA 100 sits way, way up at 0.0212102. And it's giving a massive "Strong Sell" signal. That's a gap. A huge one. The current price is almost ten times lower than the 100-period Exponential Moving Average. That, right there, should make anyone stop and think. It tells you the underlying, longer-term trend for Sidekick / USDT price today isn't some glorious ascent. It's still battling gravity.
We're talking about Sidekick / USDT here. The price is at 0.002467. The EMA 100 says 0.0212102. That's a brutal reality check, suggesting this rally might be short-lived. A temporary burst in a larger downtrend. The 1M high was 0.007274, so even that big run up earlier wasn't sustained. It just highlights how choppy things are. If you're into charting this stuff yourself, our free advanced charting tool could be useful.
My Take: This Looks Like a Set Up
So, you have a monstrous daily gain, but a deeply negative signal score and a long-term moving average screaming "Strong Sell." This isn't a robust recovery. This is a flash in the pan, waiting for the unwary to jump in before the rug gets pulled. That Stochastic K% saying "Strong Buy" is probably just reacting to the intraday momentum, not anything fundamental.
Sidekick / USDT forecast 2026? Unless something drastically changes, I'm not seeing long-term bullish sentiment. It feels like a trap. Given the current Sidekick / USDT analysis, with the price pushing towards some resistance levels — R1 at 0.001717, but with P at 0.001562, it's already above that initial pivot, but that EMA 100 just looms. I'd avoid KUSDT for now.