
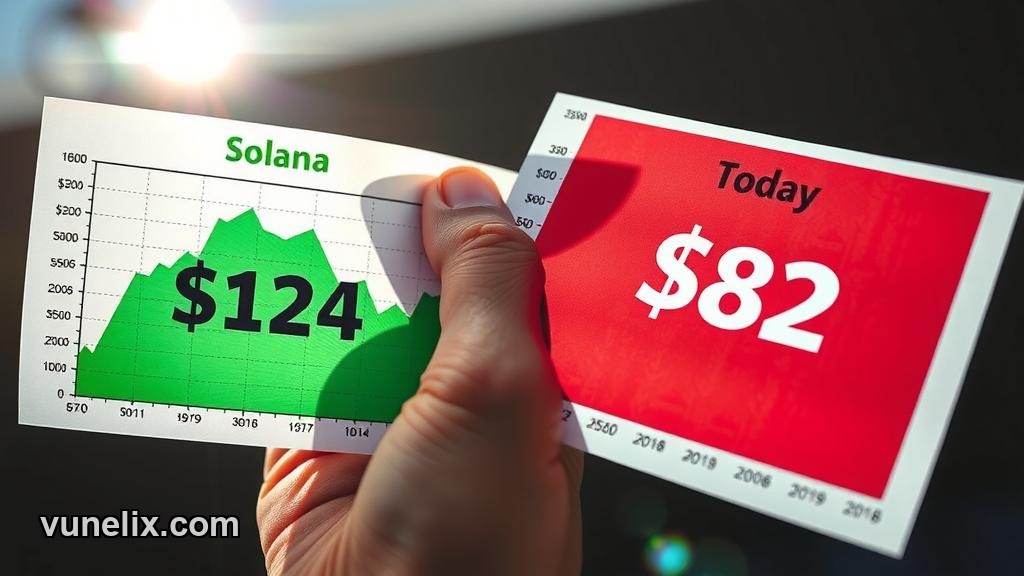
$82.27. That's where Solana closed today after opening at $85. Down 3.25%, sitting below every moving average that matters, and the signal says sell with a -56.4 score. But the RSI is at 33, which is textbook oversold territory. So which one's lying?
Neither. They're just reading different timeframes, and that's the problem.
The Sell Signal Isn't Wrong
Look at the moving averages. SMA 100 is at $124. EMA 10 is at $85. Price is under both. That's not a dip, that's a downtrend. Six months ago Solana was trading 54% higher. One week ago it was still higher than today. The momentum isn't there.
ADX at 60 says the trend is strong. Problem is, it's a strong down trend. ADX doesn't care about direction, just strength. And yeah, the trend is strong — strongly bearish. MACD is negative at -9.49, which technically flips to a buy signal when it's that low, but it's still under zero. That's not bullish, that's just less bearish.
The Bollinger Bands put Solana at 37.97% of the range. Middle band is at $96. We're $14 below that. Not hugging the bottom yet, but closer to panic than comfort.
RSI Says Oversold But Who Cares
RSI at 33 is technically a buy signal. Under 30 is oversold, and we're close. I've seen this before — people pile in because "it's cheap now" and then watch it drop another 10%. Oversold doesn't mean reversal, it means sellers are still in control and they're just getting tired.
You can stay oversold for weeks. Check the broader crypto market and you'll see plenty of coins sitting in oversold territory while everyone waits for a floor that never comes. RSI is a signal, not a guarantee.
MACD level at -9.49 is deep negative. When it's this low it sometimes bounces, but the histogram hasn't crossed yet. No confirmation. Just hope.
The Pivot Points Nobody's Watching
Woodie pivot puts resistance at $87.40 and support at $82.68. We're basically sitting on support right now. If $82.68 breaks, next stop is probably $80 or lower. That's the number I'm watching. Not $85, not $87 — $82.68 is the line.
Resistance at $87.40 means even if we bounce, there's a wall right above us. And with the EMA 10 at $85, you've got two blockers stacked between here and any real recovery. That's not a setup I want to fight.
Price Action Says Bullish But I Don't Buy It
The data labels this as "bullish price action" but the signal score is -56.4 and every moving average disagrees. Maybe there was an intraday bounce or some short-term buying, but zoom out and it's red across the board. This is what false signals look like — conflicting data that makes you second-guess everything.
I ran this through Vunelix's charting tool and the picture is clearer when you stack the indicators. ADX says strong trend, moving averages point down, MACD is negative, Bollinger middle is way above price. The only thing screaming buy is RSI, and that's the weakest signal in the stack.
What I'd Do Here
Nothing. I wouldn't buy at $82 hoping for a bounce and I wouldn't short it either because RSI could pop and squeeze me out. This is no man's land. If you're holding SOL, you're either down bad already or you bought way lower and you're deciding whether to take profit. If you're thinking about entering, wait for $82.68 to hold or break.
If support breaks, I'm looking at $78-$80 as the next zone. If it holds and we get back above $85 with volume, maybe the RSI bounce is real. But right now? It's a mess. The six-month performance is -54%. That's not a correction, that's a wipeout. And Layer 1 tokens across the board are struggling, so this isn't just a Solana problem.
The All-Time Low That Nobody Mentions
Solana's all-time low was $0.21. We're at $82. That's a 385x move from the bottom, and a lot of people forget that context when they see a 54% drop. Yeah, it hurts if you bought at $150 or $200, but this thing still has a long way to fall before it's remotely close to crisis levels. I'm not saying it'll get there, just that perspective matters when you're staring at red numbers.
The sell signal isn't random. It's reading trend, momentum, and structure, and all three are pointing the same direction. RSI is the outlier, and I don't trust outliers when everything else is aligned.
Bottom Line
Solana at $82 with a sell signal and oversold RSI is a coin flip wrapped in broken charts. If you're hunting for a bottom, you might be early. If you're waiting for confirmation, you're still waiting. I think we test $80 before we see $90 again, but I've been wrong before and I'll be wrong again.
Solana breaks $82 support in the next 48 hours or bounces back to $85 — and neither move changes the bigger picture yet.


