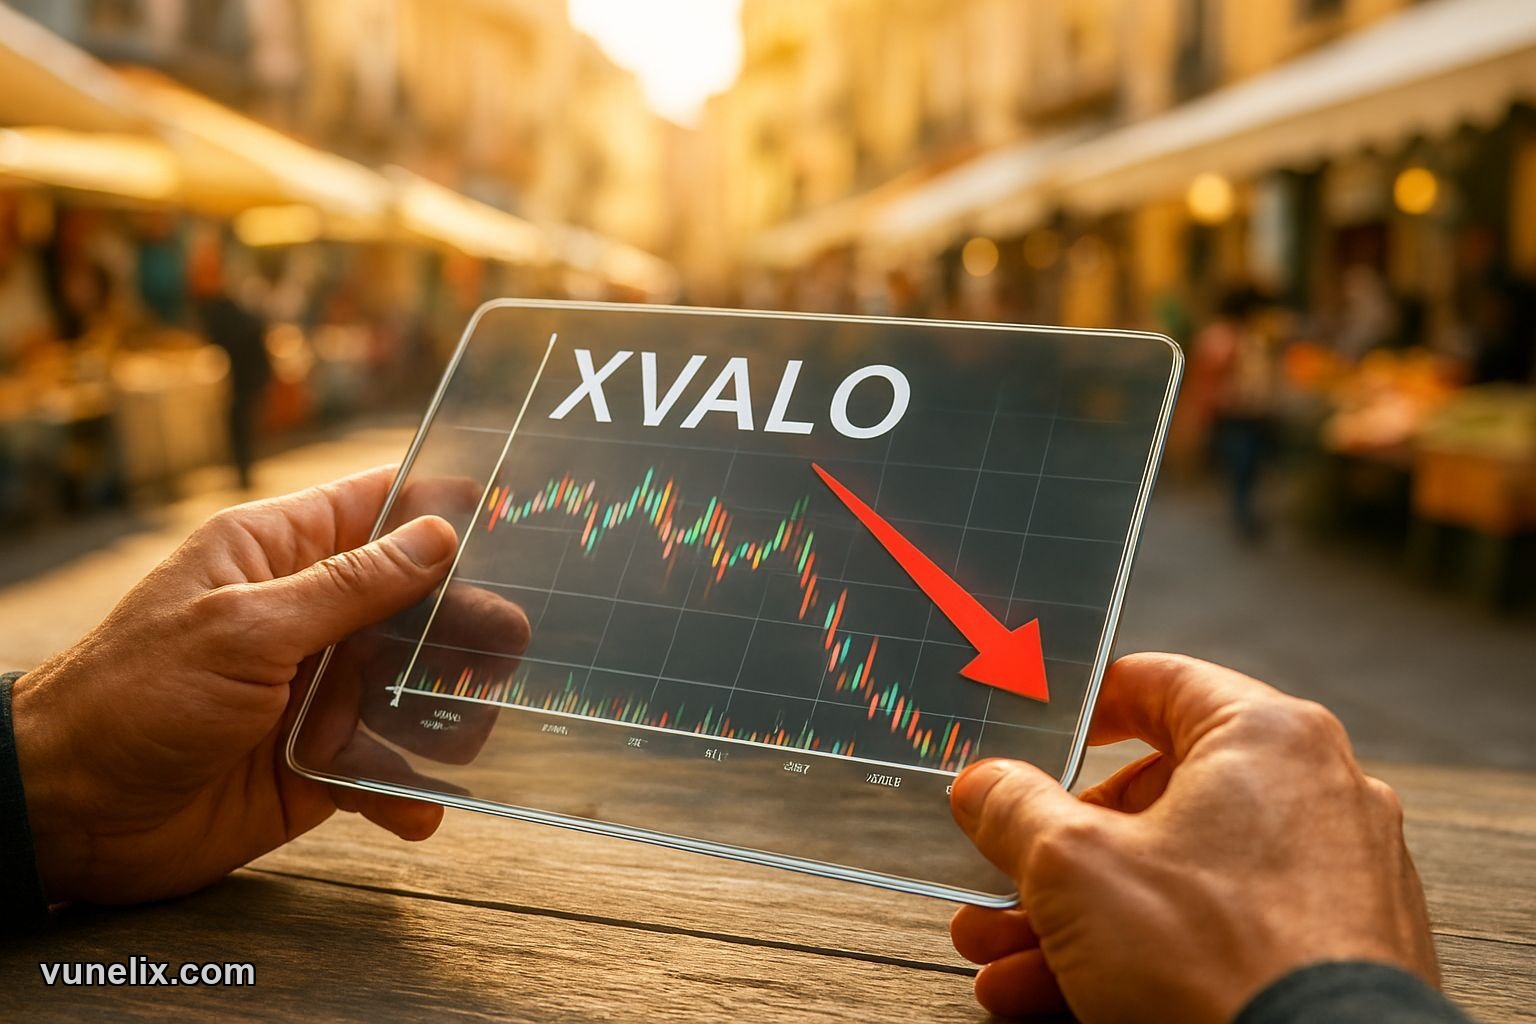
Today, February 15, 2026, Vale S.A. (XVALO) took a dive. We're looking at a 13.68 price tag, down almost 5% from its open at 14.388. A drop like that on what some tools are still screaming is a "Strong Buy" signal? That's the kind of contradiction that keeps traders up at night, and frankly, makes you wonder who's right.
I’ve seen this movie before. Everyone chasing the next big thing, ignoring the red flags flapping right in their face. This isn't some textbook exercise on Vunelix, this is real money on the line. When the signals get this messy, you have to dig past the headlines and look at what’s really going on under the hood.
The Hammer, The Drop, and The Doubts
So, XVALO closed down today, 4.921% to be exact. It’s sitting at 13.68, a good chunk lower than its open. But here's the kicker: the candle pattern for today? A Hammer. Now, if you know anything about technical analysis, a Hammer candle at the bottom of a downtrend is usually considered bullish. It implies buyers stepped in after an initial sell-off, pushing the price back up towards the open.
A beautiful sight, usually. But we just saw nearly a five percent plunge. So, is this a strong reversal about to happen, or is it just a dead cat bounce disguised as a fancy candle? My gut says don't trust a single candle, no matter how pretty it looks, especially when the initial drop was this brutal. The market isn't always that forgiving.
You can see this pattern play out across markets sometimes. Go check out the US indices overview; you’ll find plenty of instances where a 'bullish' pattern got eaten alive by underlying sentiment.
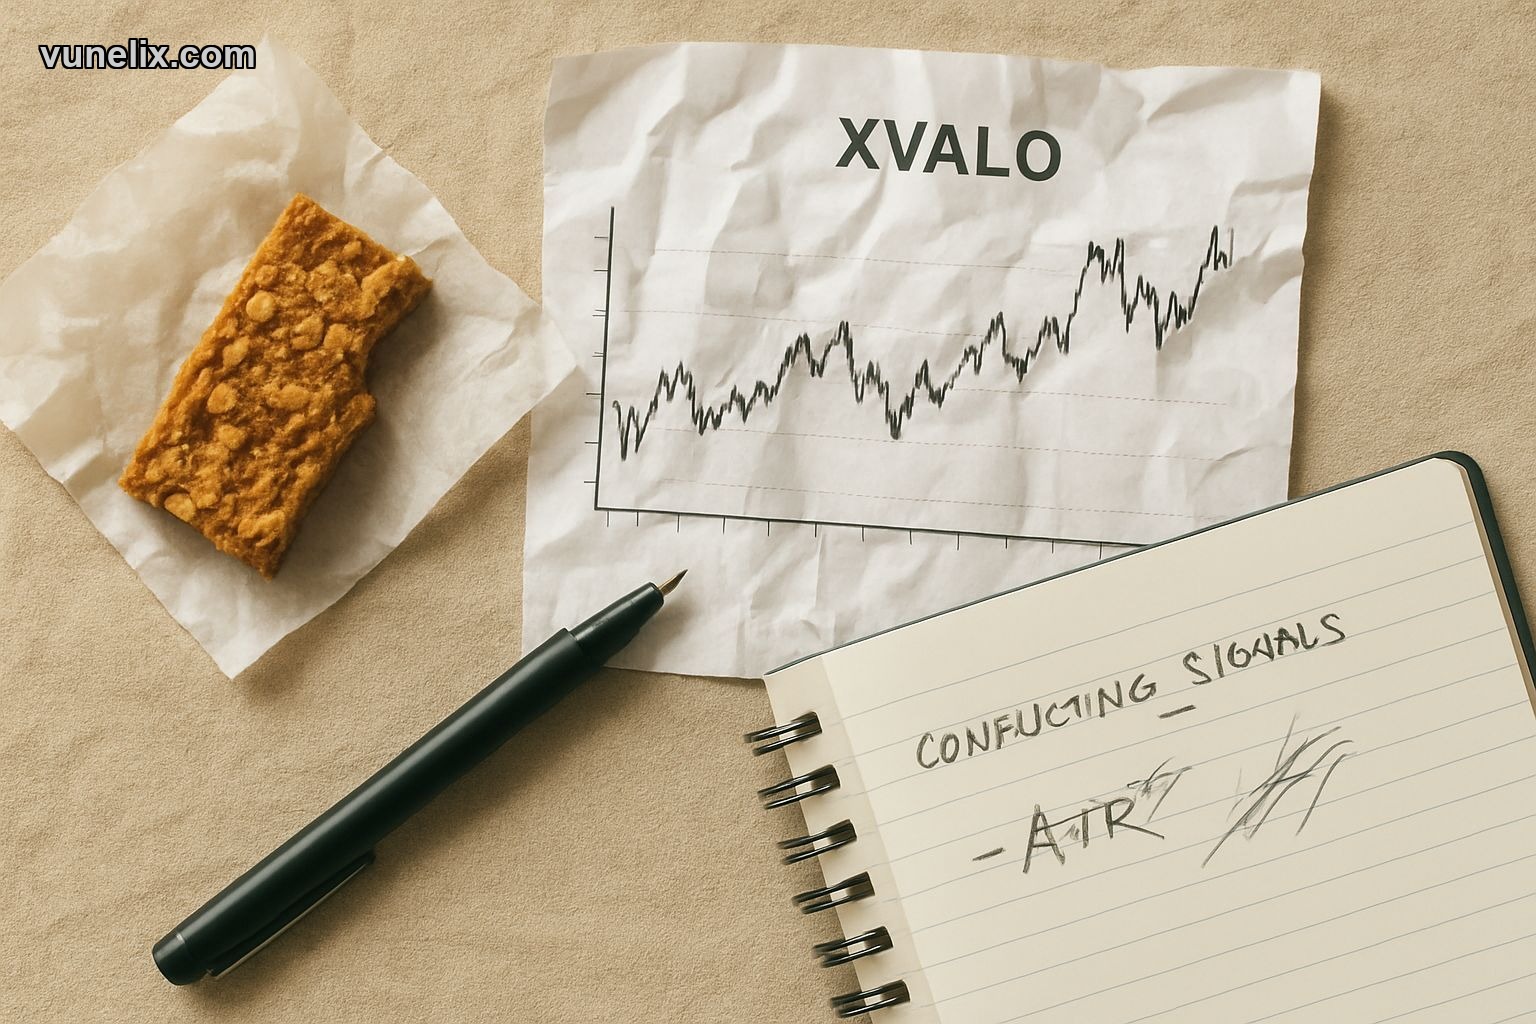
Oscillators and Averages: A Conflicting Mess
This is where it gets interesting, and honestly, frustrating. If you're looking for a clear path on Vale S.A., good luck. The data is all over the place. Let's break down some of these signals right now:
- RSI: 53.5544 (Neutral)
- Parabolic SAR: 13.3516 (Strong Buy)
Okay, so one says neutral, the other says buy. Not exactly a ringing endorsement, is it? It’s like getting investment advice from two different friends who heard totally different gossip. You're left guessing. The Parabolic SAR might be lagging here, catching the tail end of yesterday's momentum, completely missing the actual price action today.
And the moving averages? Even worse:
| Indicator | Value | Signal |
|---|---|---|
| EMA 100 | 11.697 | Strong Buy |
| EMA 25 | 13.5175 | Strong Buy |
| SMA 10 | 14.0444 | Strong Sell |
Look at that! Two strong buys from the Exponential Moving Averages, suggesting longer-term positive momentum might still be in play. But then the SMA 10, the short-term simple moving average, is screaming "Strong Sell." This is the kind of stuff that makes you second-guess everything you thought you knew. How can a stock be both a "Strong Buy" and a "Strong Sell" at the same time? It means short-term pain is staring down longer-term potential. And let's be real, a lot of people care about the short term.
When you see this much disagreement, it's not a green light; it's a giant, flashing yellow. It signals volatility, uncertainty, and a high probability of whipsaws. That's how accounts get blown up. Chasing one signal, getting burned, then chasing the other, and getting burned again. It's a classic trap. This looks like a prime candidate for a deeper dive on the stock market heatmap to see how other materials stocks are faring.
The Ghost of Highs Past and Volatility's Bite
Let's not forget where XVALO has been. The all-time high of 27.8 just hangs there, a constant reminder of better days, nearly double where it sits now. We're nowhere close to those levels, and thinking this drop, even with a Hammer candle, is a quick path back up is probably wishful thinking. The stock is down today, significantly. That kind of drop shakes confidence, no matter what your charts say.
And the volatility? High. The ATR% is at 3.3643%. That means you can expect wide swings. High volatility isn’t inherently bad if you're on the right side of it, but when the signals are as mixed as they are for Vale S.A. right now, high volatility just means higher risk. Higher chance of losing money fast if you get it wrong. It magnifies every uncertainty.
Pivot Points and Bollinger Bands: A Cautious Dance
Looking at the pivot points, specifically the Fibonacci levels, gives us some structure amidst the chaos. The main pivot (P) is 14.4213, with resistance (R1) at 14.6475 and support (S1) at 14.1952. Considering today's close at 13.68, we’re well below that first support level. That's a bad sign, no two ways about it. Breaking through support signals further downside pressure, not an immediate rebound.
Then there's the Bollinger Bands. The middle band sits at 13.5858, and the price position is 83.87%. The squeeze is normal. A high position within the bands suggests the price is on the upper end of its typical range, which, coming after a near 5% drop, just feels… off. It’s almost like the bands are still reflecting recent upward momentum before today’s smack down. That can be a deceptive thing. High placement doesn’t automatically mean continued upside, especially when the price just cratered.
My Take: This Vale S.A. Prediction Is A Hard Pass For Now
Listen, if you came here for a crystal-clear "Vale S.A. buy or sell" signal, you won't find it delivered on a silver platter today. But here's my honest take on the Vale S.A. forecast for 2026, at least as of February 15: it's too risky. The -4.921% change today, combined with the outright war between the different technical indicators, is a red flag big enough to land a plane.
Yes, the Hammer candle is there. Yes, some moving averages scream "Strong Buy." But the SMA 10 is bearish, the price is below immediate support, and the market clearly saw fit to punish it today. This isn't a stock you jump into unless you enjoy gambling on conflicting signals and high volatility. Your chances of getting chopped up are just too high right now.
Wait for some clarity. Let the dust settle. If you’re looking for high-conviction trades, this ain’t it. Not today. You'd be better off checking out something with clearer direction, perhaps even something like Bitcoin, which at least often has more consistent short-term trends, for all its own wild swings.