$272.95. That's where Apple Inc. closed today, down 0.73% from the open. Not dramatic, but worth noting when you see a Strong Buy signal paired with high volatility. The ATR sits at 6.36, which is 2.32% of the stock price — that's not small movement for a company this size.
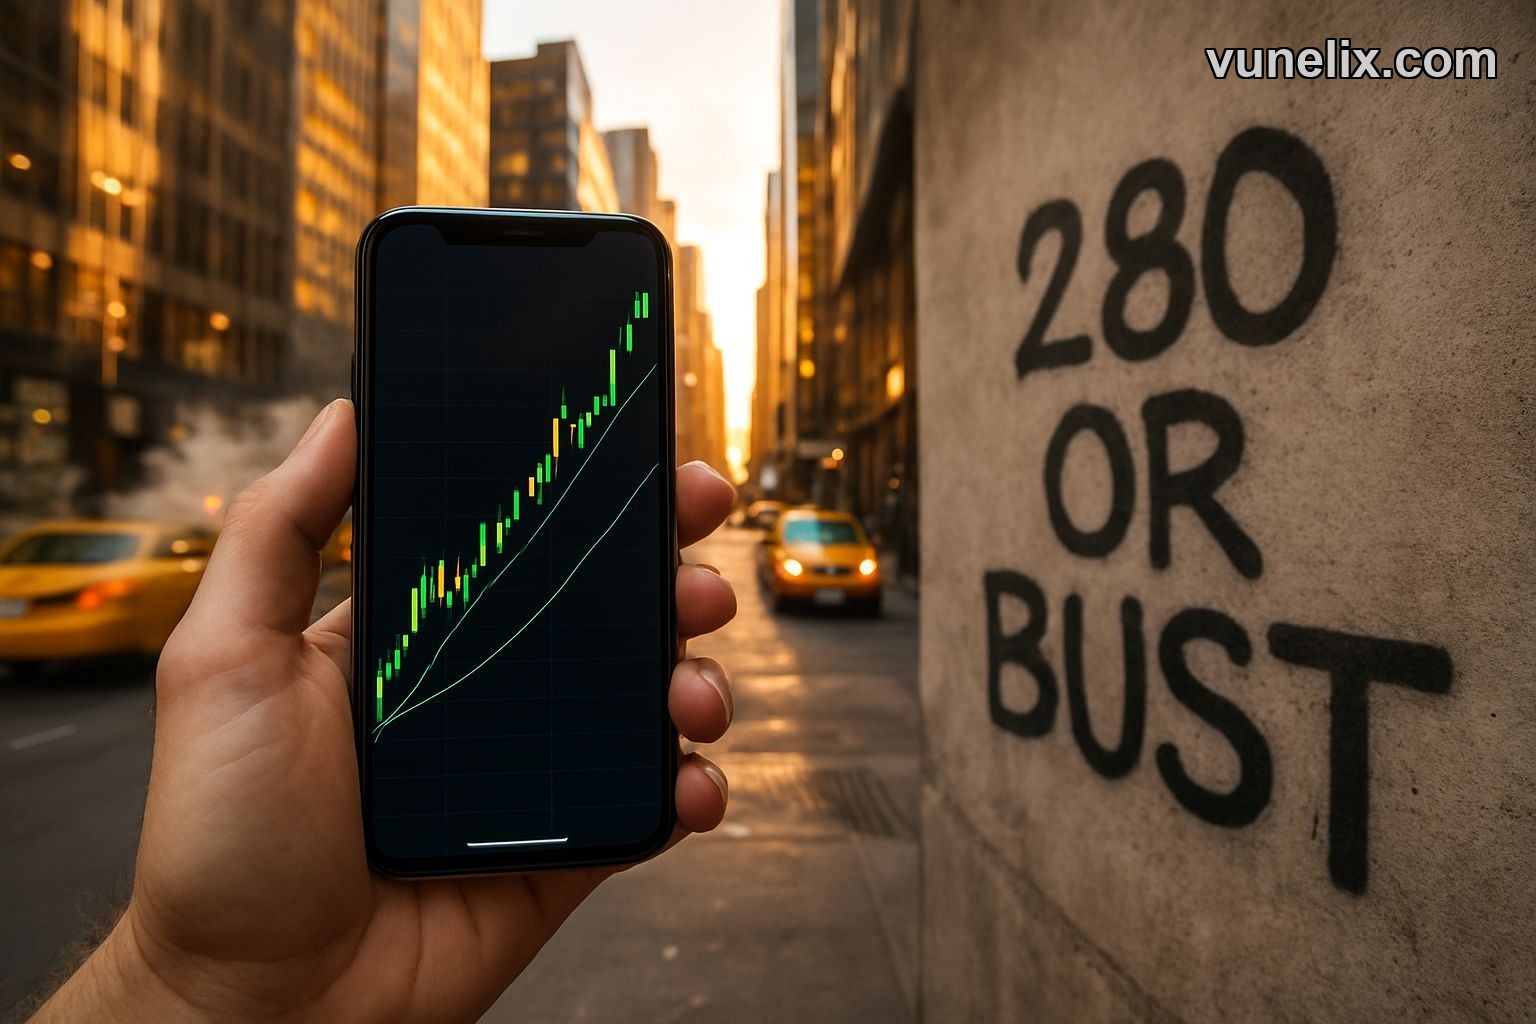
I've been watching AAPL bounce around between $252 and $280 over the past month. Today's price sits right in the middle of that range, which means nothing is decided yet. The Bollinger Band position at 71.62% tells you the stock is closer to the upper band than the lower one, but not screaming overbought.
The Signal Versus What's Actually Happening
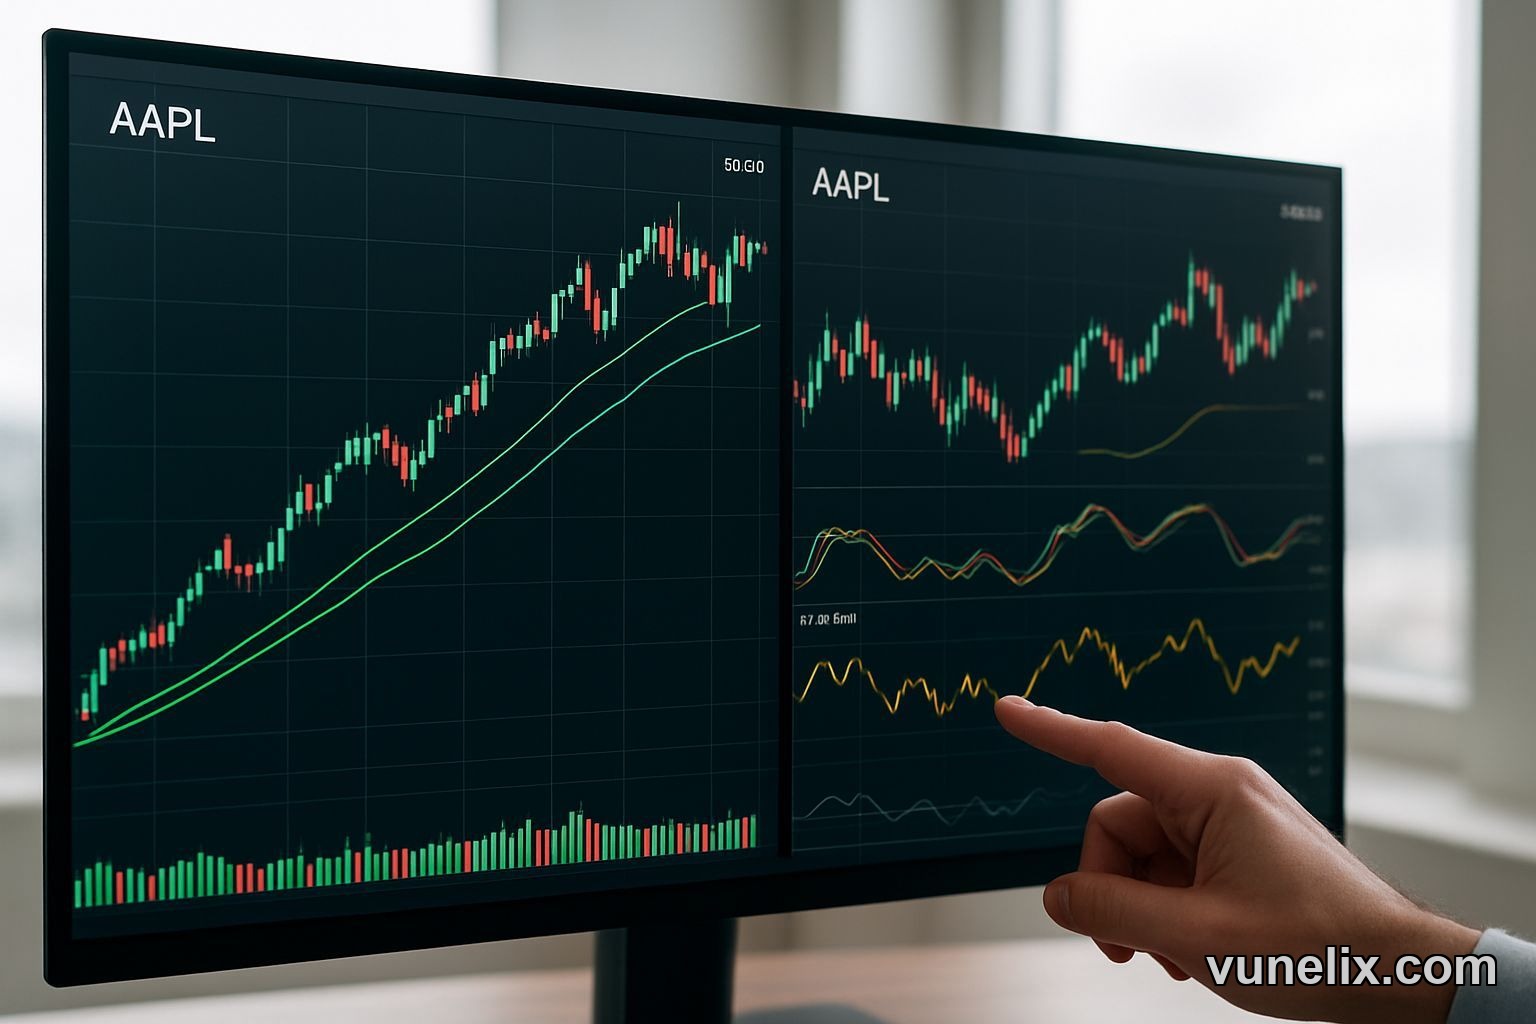
Strong Buy signal with medium confidence. Let's break that down because confidence matters more than the signal itself. The moving averages all point to buying — EMA 10 at $268.77, SMA 25 at $265.38, SMA 100 at $266.72. All three sit below the current price, which is textbook bullish alignment.
But then you look at the oscillators and it gets messy. Stochastic K% at 69.36 flashes Buy, which makes sense. RSI at 57.04 sits in Neutral territory — not hot, not cold. That's the problem with medium confidence. You're getting mixed messages from different parts of the technical picture.
The ATR saying Buy is interesting. High volatility usually scares people, but in this context it means the stock has room to move. The question is which direction.
Volatility Is The Real Story Here
ATR percentage above 2% for a stock like Apple Inc. isn't normal calm sailing. The one-month range from $252 to $280 is a $28 spread. That's over 10% movement in 30 days for a company everyone calls "stable."
I've seen this pattern before. High volatility with Strong Buy signals means institutional money is repositioning. Retail investors see the chop and get nervous. Big money sees opportunity to accumulate at better prices when the stock dips below $270.
The stock market heatmap shows AAPL moving more than most mega-cap names lately. That's not random. Something's shifting in how the market prices this stock.
The Levels That Actually Matter
Camarilla pivot points put R1 at $274.59 and S1 at $273.87. Today's close at $272.95 sits just below S1, which means the stock broke through minor support. Not catastrophic, but worth noting.
The real support is that $265-$266 zone where all the moving averages cluster. If AAPL drops below $265, the whole Strong Buy thesis gets shakier. Above $275, and you're back in the bullish zone heading toward that $280 resistance.
I pulled up the advanced charting tool on Vunelix earlier to map out the one-month price action. The stock has tested $280 twice in the past four weeks and failed both times. Third time might be different, or it might confirm that level as real resistance.
What The Moving Averages Actually Tell You
EMA 10 moving faster than the SMAs makes sense. It reacts quicker to recent price movement. The fact that it's at $268.77 while the SMA 100 sits at $266.72 shows the short-term trend is stronger than the longer-term average. That's good if you're bullish.
But here's what bugs me. The stock closed at $272.95 today after opening at $274.95. That's a $2 drop intraday. Small in dollar terms, but it erased the gap between price and the EMA 10. When price starts hugging the EMA 10 instead of running above it, momentum is slowing.
What I'm Doing With This Data
I'm not chasing Apple Inc. at $272.95 with a Strong Buy signal and medium confidence. The volatility is too high and the stock just tested $280 and failed. If it drops back to $268 or below, I'd be more interested because you're buying near the EMA 10 with all the other moving averages as backup support.
The Stochastic K% at 69.36 isn't in overbought territory yet, but it's getting close. RSI at 57 gives you room, but not a ton of room. This isn't a screaming buy at current levels. It's more of a "wait for a better entry" situation.
I've been tracking names on the most active stocks list, and AAPL shows up consistently. That means volume is there. When volume is high during choppy price action, it usually means disagreement. Bulls and bears both showing up with conviction.
The All-Time Low Number Is Wild
All-time low at $0.049. Yeah, that's adjusted for splits going back decades, but still. A stock that once traded for nickels now trades for $272.95. The long-term trajectory is obviously up, but that doesn't tell you anything about what happens next week or next month.
Short-term traders don't care about the all-time low. They care about the one-month high at $280.91, which the stock couldn't break today despite opening near $275. That failed breakout attempt matters more than the long-term chart for anyone trading this on a weeks-to-months timeframe.
Final Take
Strong Buy signal with medium confidence, bullish price action, but high volatility and a recent rejection at $280. The moving averages support the bullish case, but the oscillators are mixed and the stock is trading near the upper Bollinger Band without breaking resistance. Not a clear slam dunk either way.
If you're already long AAPL, the technical setup says hold. If you're looking to enter, wait for a pullback to $268 or a clean break above $280 with volume. Current price at $272.95 is no man's land — not cheap enough to buy, not extended enough to short.
Apple Inc. will retest $280 within the next two weeks, and if it breaks through with conviction, $290 is the next logical target.