Ecopetrol SA closed at 2280 on March 3, 2026. That's 20% above where it traded six months ago. The signal says Strong Buy with 69.1 confidence. I'm not betting against it, but I'm also not ignoring the cracks showing up in the shorter-term indicators.
This is Colombia's biggest oil company. The stock moves with crude prices, local politics, and production numbers. Right now it's riding a trend that started last fall. The question isn't whether the trend exists — it's whether it keeps going or stalls out here.
The 200-Day Average Backs This Move
The SMA 200 sits at 1898.85. That's a Strong Buy signal on its own. Ecopetrol is trading nearly 400 points above that line. When a stock clears its 200-day by that much, it usually means institutional money came in and stayed. Retail doesn't push stocks 20% over long-term averages and hold them there.
The EMA 25 is at 2239.37, also signaling Strong Buy. That's the recent average — last month's action compressed into one number. Price is above it by about 40 points. Not a huge gap, but enough to show buyers are still active on shorter timeframes.
I've seen stocks run another 10-15% after breaking above both of these levels. I've also seen them roll over hard when the short-term technicals start flashing red. That's where the messiness starts with Ecopetrol.
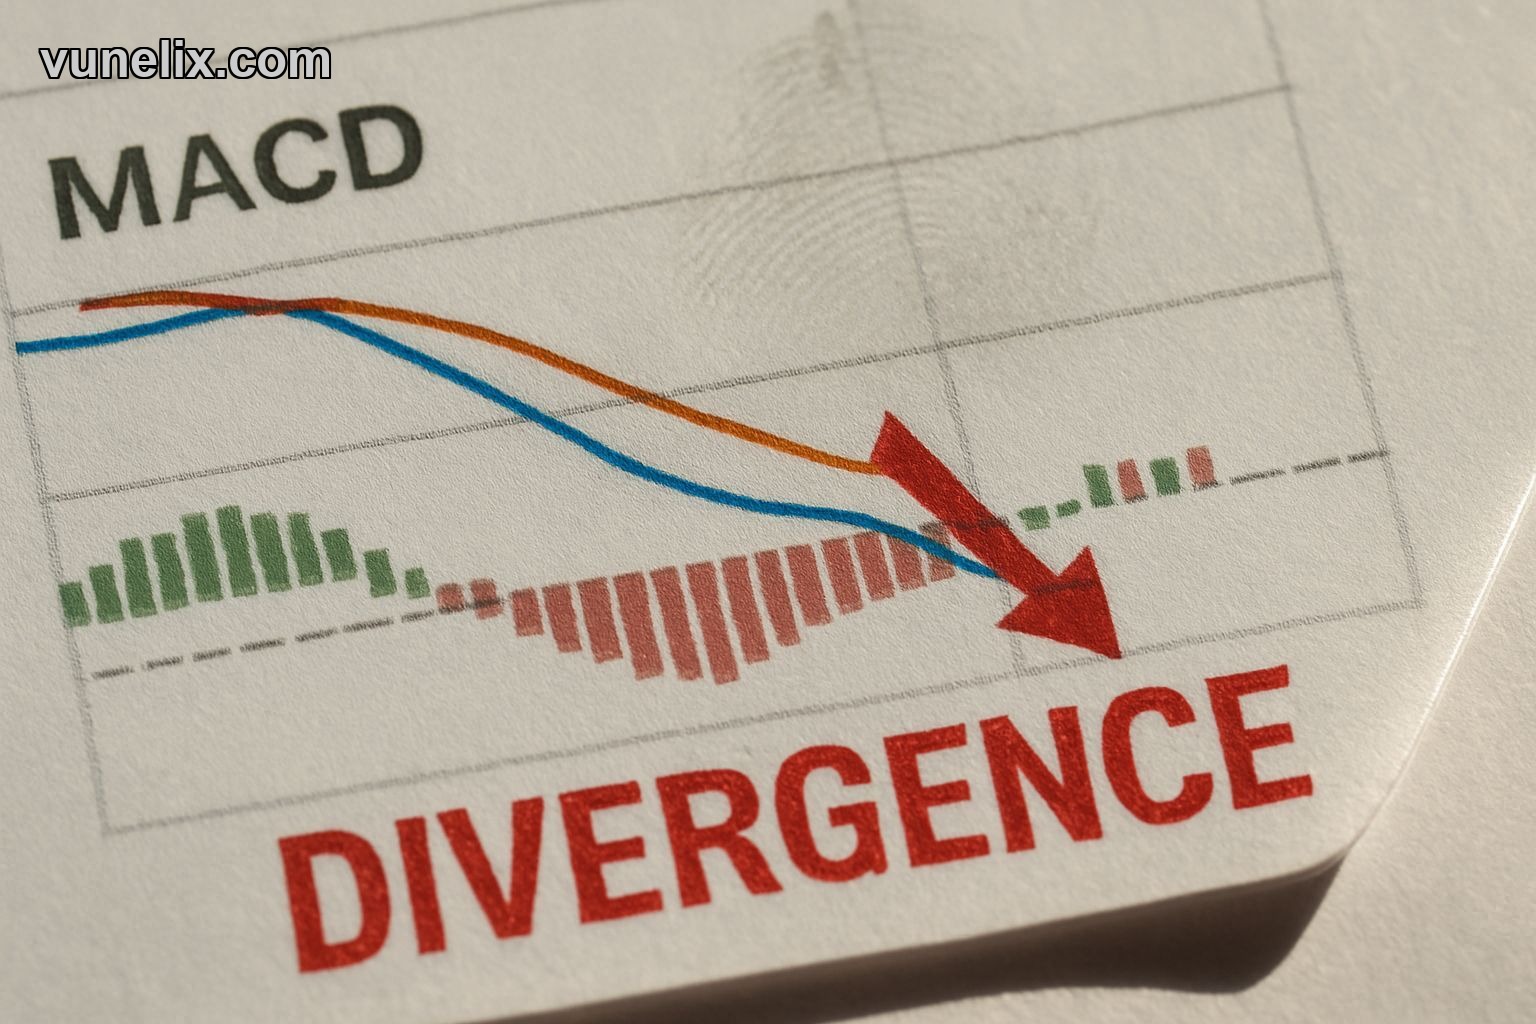
MACD Tells a Different Story
The MACD level is at 31.3346 with a Sell signal. That's the momentum oscillator disagreeing with the moving averages. When MACD goes negative on a stock that's still above its 200-day, it means one of two things: either the moving averages are slow and MACD is early, or MACD is picking up noise while the bigger trend holds.
I lean toward the first option here. The MACD crossover happens before price turns. It's not a guarantee, but when you see a Sell on MACD while price is still climbing, you're usually 2-4 weeks away from a pullback. Sometimes you're early. Sometimes you're right on time.
The Ultimate Oscillator is at 41.2229, which lands in Neutral territory. That's the oscillator that blends three timeframes to smooth out fake signals. Neutral means no edge either way. It's not confirming the rally, but it's not screaming caution either.
Volatility Is High and That Matters
The ATR is at 76.9769. That's high volatility — the stock moves around a lot day to day. ATR percentage is 3.44%, which means on an average day this thing swings 3.4% in either direction. If you're buying at 2280, you could wake up to 2200 or 2360 without any real news.
The pivot points give us short-term levels. Woodie's R1 is at 2280 — exactly where price closed. S1 is at 2200. That's an 80-point cushion before the first support breaks. Demark's R1 is slightly lower at 2272.5, S1 at 2192.5. The ranges overlap, which tells me these levels matter.
If Ecopetrol breaks below 2200, I'd expect a fast move down to 2150 or lower. If it pushes above 2300, the next resistance probably sits around 2350-2400 based on the ATR range. High volatility cuts both ways. You can make money fast or lose it fast.
Recent Performance Shows Weakness Creeping In
Six-month performance is 21.93%. That's solid. But the one-week performance is -2.15%. The stock gave back gains last week. That matches what the MACD is saying — momentum shifted recently. A stock screener would flag this divergence between longer and shorter timeframes.
I don't love buying a stock that just dropped 2% in a week when the MACD already flipped to Sell. You're catching a falling knife if the trend actually broke. But if this is just noise and the six-month trend resumes, you're buying a dip before the next leg up.
The confidence level is Medium. That's Vunelix telling you the signal isn't bulletproof. Strong Buy doesn't mean guaranteed win. It means the weight of evidence leans bullish, but there's enough uncertainty that you could easily be wrong.
What I'd Do With This Setup
I'd wait for one more piece of confirmation before jumping in. If Ecopetrol holds 2200 this week and the MACD starts curling back up, that's a buy. If it breaks 2200 and closes below it two days in a row, I'd stay out until it finds a floor.
The trend is up. The long-term averages support it. But the short-term signals are mixed and the volatility is high enough to hurt if you time it wrong. I've been burned buying Strong Buy signals when MACD was already selling. Sometimes the MACD is early, but sometimes it's right and you just paid top dollar before a 10% drop.
If you're already in, I'd set a stop at 2180. That's below the Demark S1 and gives you room for normal noise without getting shaken out on a random down day. If you're looking to enter, watch how it behaves around 2250 this week. A charting tool helps track intraday action when volatility is this high.
Colombia's oil sector has political risk baked in. Always has. Production policy can shift fast depending on who's in power and what crude prices are doing globally. Ecopetrol moves with WTI, but it also moves with local headlines. That adds another layer of uncertainty on top of the technical picture.
The Strong Buy signal is real. The 200-day support is real. But so is the MACD divergence and the recent weakness. I'm not calling this a sell, but I'm also not calling it a no-brainer buy at 2280. It's a wait-and-see unless you're comfortable riding out a potential 5-10% pullback before the next move higher.