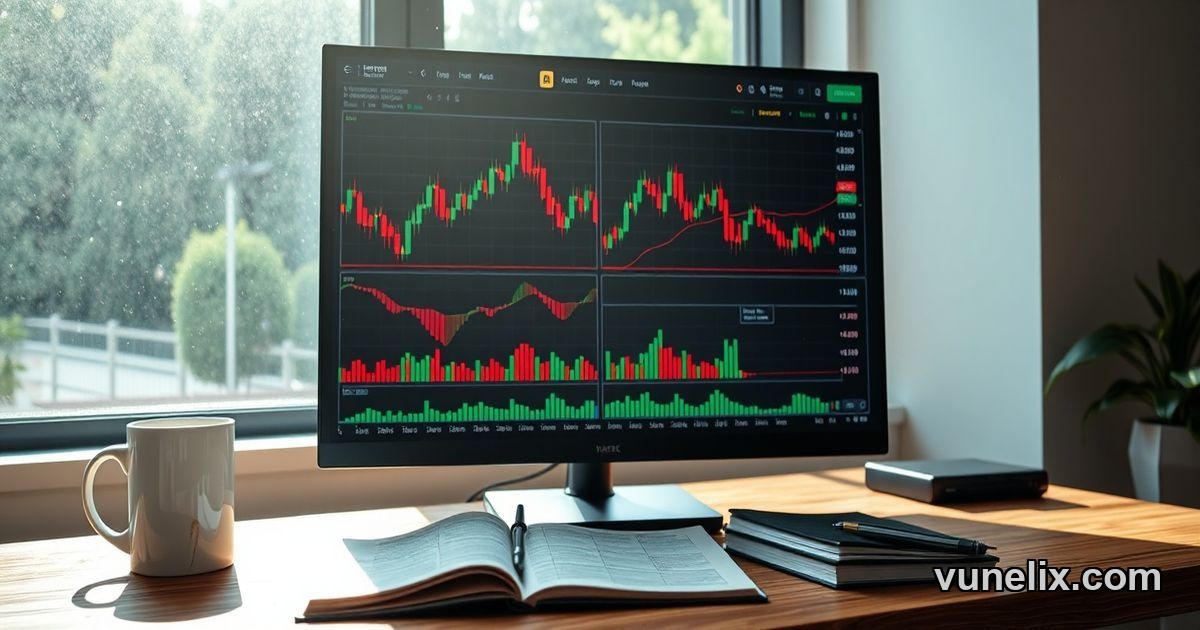
A Doji on a buy signal is the kind of chart that makes you pause mid-click. CLPBOB sits at 0.0079 today, down 1.25% from its 0.008 open, and the candle's indecision is screaming louder than any oscillator.
The buy signal holds at 51.8 score, but that's weak conviction. I've learned the hard way that "buy" doesn't mean "buy right now" when the chart looks unsure. The Stochastic K% at 83.33 is a strong sell reading — overbought territory that usually precedes a pullback. But the ADX at 37.56 says the trend is strong, and it's pointing up.
The Trend vs. The Oscillators
This is where CLPBOB gets messy. You've got a strong trend confirmed by ADX above 25, which should push you toward the buy camp. The EMA 200 at 0.0074 is well below current price — that's a strong buy on the moving average side. Six-month performance sits at 11.27%, not bad for a pair most people can't even spell.
But look at the Stochastic. 83.33 is not a "maybe overbought" level — it's deep into strong sell territory. RSI at 53.95 is neutral, which doesn't help at all. It's like getting two opposite weather forecasts and having to decide whether to pack an umbrella.
I don't love this setup. When oscillators and trend indicators disagree, I default to waiting. That Doji is your chart telling you it doesn't know what's next either.
Bollinger Position and Volatility
CLPBOB is sitting at 73.85% within the Bollinger Bands. Not quite touching the upper band but close enough to make you wonder if it's running out of steam. The middle band at 0.00787 is slightly below today's price, so technically you're still in the upper half of the range.
ATR percentage is 0.8251 — medium volatility. Not dead calm, not wild swings. The one-month high matches today's open at 0.008, which means we just tested resistance and failed. That's not a bullish look.
| Indicator | Value | Signal |
|---|---|---|
| Stochastic K% | 83.33 | Strong Sell |
| ADX | 37.56 | Strong Buy |
| EMA 200 | 0.0074 | Strong Buy |
| Bollinger Position | 73.85% | Near Overbought |
If you're hunting for exotic FX pairs with momentum, check out the currency converter to see how CLPBOB stacks up against more liquid crosses. Sometimes the spread alone kills the trade.
What the Pivot Points Say
Both Demark and Camarilla pivots cluster tight around 0.008 for resistance and support. That's not useful. When pivots bunch up like that, it means the market hasn't established clear levels yet. You're trading in a narrow band, which fits the Doji narrative.
The SMA 25 and EMA 25 both hover near 0.00787, giving neutral signals. No directional bias there. You want moving averages to fan out and give you a clean trend — this is a knot.
I lost money once on a similar setup with GBPUSD back when I ignored the Doji and chased the ADX. The pair chopped sideways for two weeks and I got stopped out twice. Learned to respect indecision candles after that.
Six Months of Gains Don't Mean Tomorrow
That 11.27% six-month return is real, but past performance on thin pairs like CLPBOB means less than you think. Liquidity gaps can fake momentum. One big order can swing the price 2% in seconds, and you're left holding a position that moved for no fundamental reason.
The buy signal at 51.8 score is barely above neutral. I'd want to see 60+ to trust it, especially with that Stochastic screaming overbought. If you're already long, maybe take some profit near 0.008. If you're thinking of entering, I'd wait for either a pullback to 0.0078 or a break above 0.008 with volume.
You can scan for better setups on the stock screener if currency pairs feel too thin. Sometimes the risk-reward just isn't there, and that's fine. Not every chart deserves your capital.
The Doji Doesn't Lie
Doji candles are transition signals. They show up when bulls and bears are locked in a stalemate. Could go either way next. The problem is you don't know which way until it's already moved, and by then you're either too late or you took a bad entry.
CLPBOB opened at 0.008, closed at 0.0079. Small range, but the fact it couldn't hold the open tells you sellers showed up. That's not a buy-the-dip moment — that's a wait-and-see moment.
If the ADX stays strong and price breaks above 0.008 tomorrow, the buy signal might validate. But today? This chart is 50/50, and I don't bet on coin flips. Would you trust a buy signal with an 83 Stochastic reading, or are you waiting for confirmation like I am?