Most forex tools give you one currency pair at a time. Vunelix dumps the whole matrix on you at once.
That's the core difference. You land on the cross rates table and see 12+ currencies against each other — EUR/GBP, JPY/CHF, AUD/CAD, all live. Not drilling down through menus, not opening six tabs. One table.
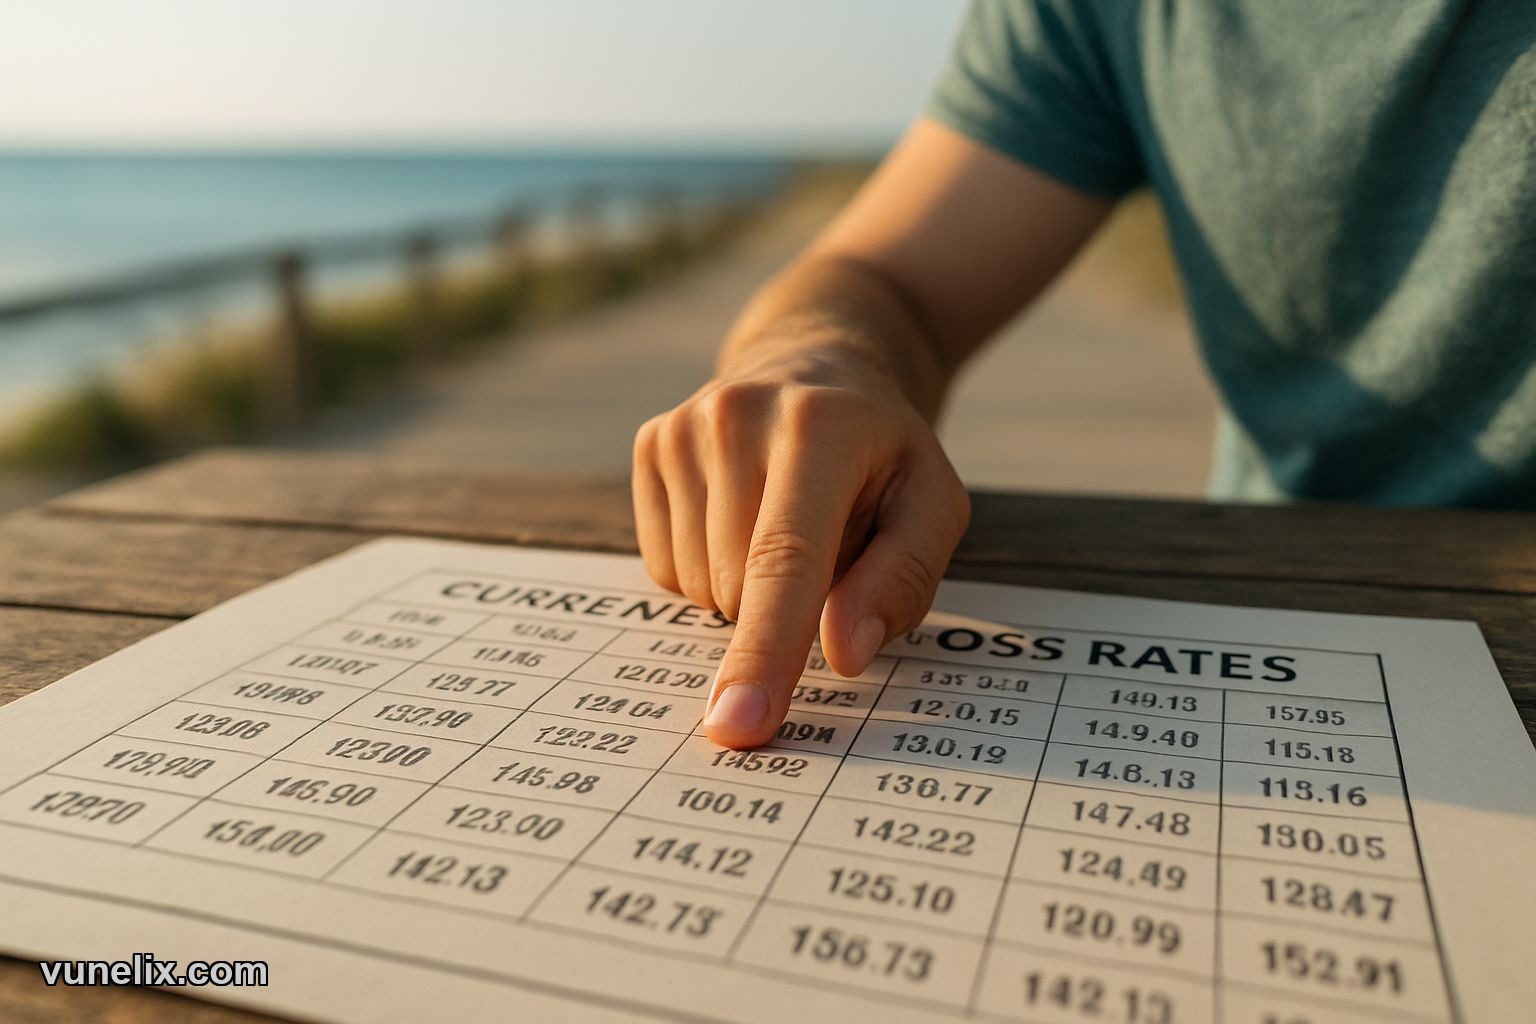
What the Cross Rates Table Actually Does
It's a grid. Rows are currencies, columns are currencies, cells show exchange rates. Updates every second during market hours via WebSocket, which means you're not refreshing the page like it's 2015.
The real use case isn't checking "how much is a euro worth" — you don't need a cross rates table for that. It's for spotting relationships. EUR weakens against USD but strengthens against GBP? That's two data points in one glance. You start seeing correlations instead of isolated pairs.
I've used it mostly when I'm already in a trade and want to check if a move is currency-specific or broad. If USD is ripping against everything, that's one story. If it's only strong against JPY and weak against everything else, different story.
You can customize which currencies show up. Default is majors — EUR, GBP, JPY, CHF, AUD, CAD. But you can add CNY, INR, MXN, whatever. There's a preset for Americas, Europe, Asia Pacific. Or build your own list.
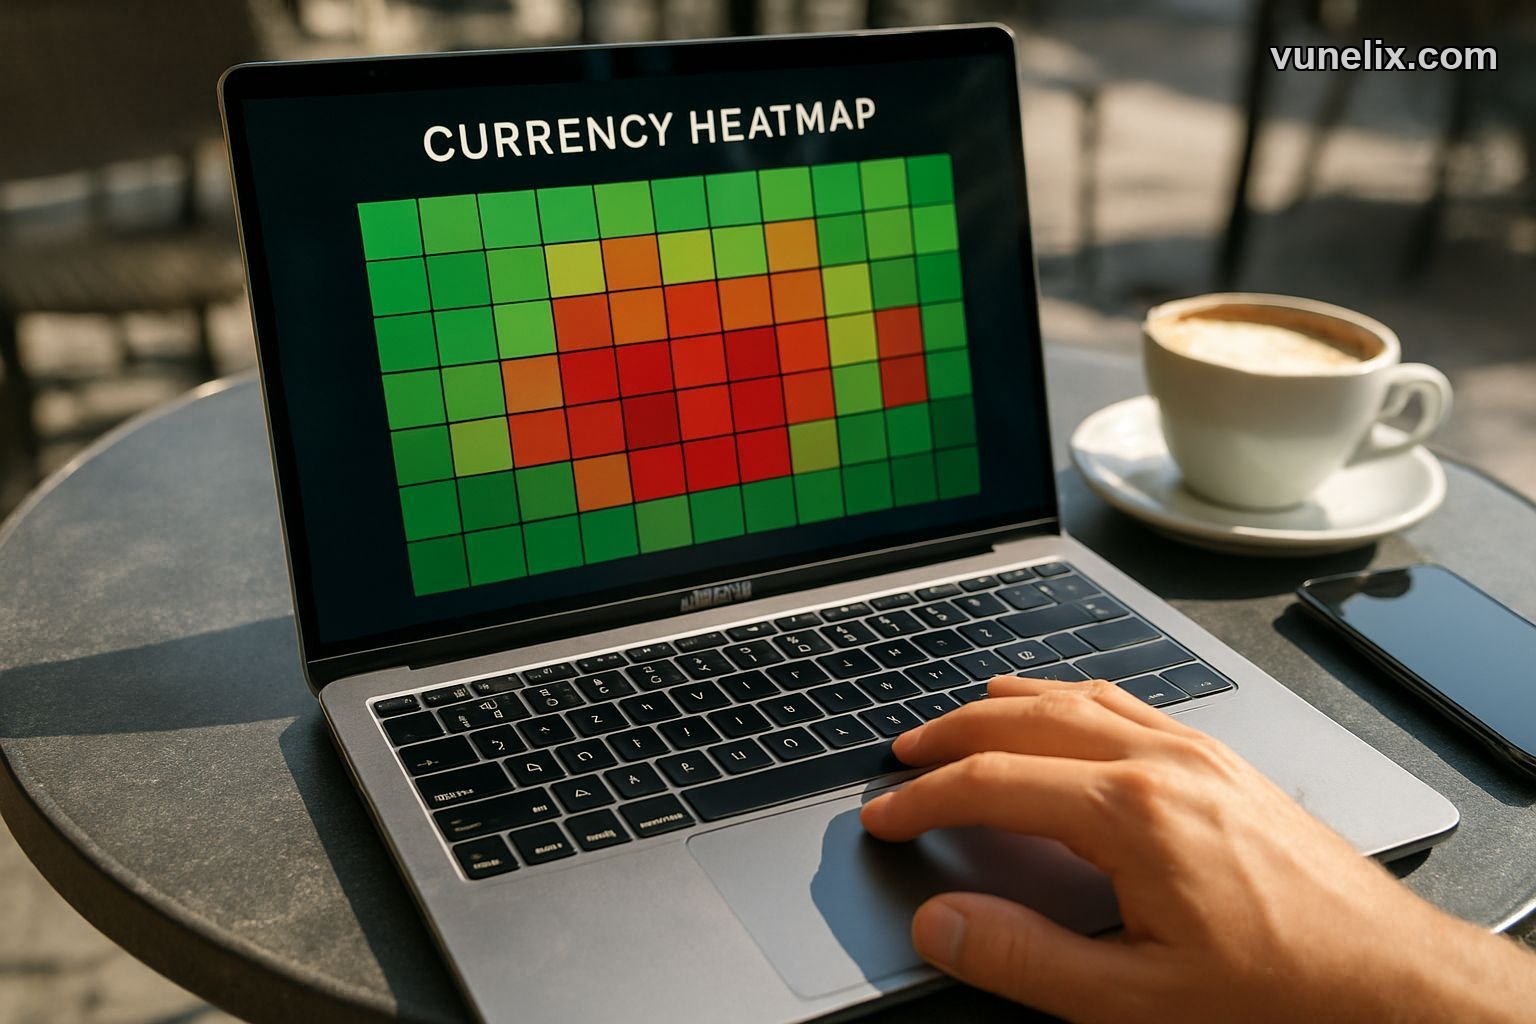
Heatmap Mode Changes How You Read It
Switch from rates to heatmap and the numbers turn into colors. Green for gains, red for losses, intensity shows magnitude. It's percentage change, not absolute rates.
This is where patterns pop. A column of deep red means that currency is getting destroyed across the board. A row of green means it's strong everywhere. Mixed colors? More interesting — means selective strength or weakness.
I don't stare at heatmaps all day, but when volatility picks up or there's a surprise rate decision, it's the fastest way to see what broke. February 2026, we had that surprise ECB move — heatmap showed EUR strength in under 30 seconds. Rates table would've taken longer to process.
The color coding isn't rocket science but it works. Your brain processes color faster than scanning a dozen decimal numbers.
Beyond Cross Rates — The Rest of Vunelix
Cross rates are one tool. The site has more. Forex screener lets you filter pairs by technicals — RSI, moving averages, Bollinger bands. Not revolutionary but it's free and doesn't require signup.
Currency converter is straightforward. Type amount, pick currencies, get result. Live mid-market rates, no markup. If you're actually exchanging money at a bank or broker, their spread will be wider — these are indicative rates.
There's a standalone currency heatmap with more customization than the cross rates toggle. You can set timeframes, add more currencies, export data. Also charting tools that are decent for quick analysis. Not TradingView-level but functional.
The crypto screener and stock screener follow the same format — filter by metrics, sort by performance, click through to charts. If you trade multiple asset classes, having everything in one place beats juggling platforms.
Why This Matters (Or Doesn't)
Vunelix isn't trying to replace your broker's platform. No order execution, no account management, no leverage settings. It's a data dashboard.
The value is speed and layout. You get more context faster than tabbing between currency pair pages on most broker sites. The cross rates table especially — showing all major pairs simultaneously is genuinely useful if you trade forex beyond one or two pairs.
Is it essential? No. You can survive with your broker's platform and maybe a TradingView free account. But I keep a Vunelix tab open because loading one page beats opening five. That's it. Small efficiency gain, adds up over time.
The mobile version works fine. Table resizes, you can scroll horizontally if needed. Not as clean as desktop but usable when you're away from the screen and want to check something fast.
The Tradeoffs You Should Know
Rates are mid-market indicative. If you're actually executing a trade, your broker's bid/ask spread will differ. Vunelix shows the midpoint between buy and sell prices, which is good for analysis but not the exact price you'll get filled at.
No news feed integration. If a central bank announces something, you won't see it on Vunelix. You're still checking Reuters or Bloomberg or wherever you get news. This is purely price data and technical tools.
Limited historical depth on the free version. You can see intraday moves and maybe a few days back, but if you want to pull six months of hourly data, you'll hit limits. For that you need their API, which isn't free.
Interface is clean but not flashy. If you want tons of customization, animated charts, social trading features — wrong place. It's functional, not fancy. That's actually what I like about it but some people want more visual polish.
Who Actually Uses This
Retail forex traders who follow multiple pairs. If you only trade EUR/USD, a cross rates table is overkill. But if you're watching five or ten pairs and looking for correlations, it makes sense.
People who need quick reference data without logging into a trading account. Sometimes you just want to check a rate without opening your broker app. Vunelix loads faster and doesn't require authentication.
Anyone comparing currencies for actual exchange purposes. Planning a trip, paying an invoice, whatever — seeing the mid-market rate gives you a baseline before your bank tries to charge you 3% over spot.
I don't use it for in-depth analysis or backtesting. I use it for fast checks and broad market scans. That's the lane it fits.
The Bottom Line on Vunelix
It's a free tool that does a specific thing well — showing you multiple currency relationships at once, updated live. If that fits your workflow, you'll use it. If you trade one pair and don't care about cross-currency dynamics, probably not.
No account needed, no paywall for basic features, no ads cluttering the screen as of now. That might change but for February 2026 it's clean.
The cross rates table is the standout feature. Everything else — screeners, converters, heatmaps — exists on other sites too. But the layout and speed of that one table is why I keep coming back.
Are you the type who needs to see the whole forex market at once, or do you prefer focusing on one pair at a time?